Chart Of The Day: Bitcoin Plunge Signals Bears Have Again Overwhelmed Bulls

Published 2019-08-29, 02:11 p/m
META
-
BTC/USD
-

Bitcoin, which in late June briefly jumped past $13,000 to gain 236% during 2019 up to that point, has since been reversing course. As of yesterday that slide appears to have accelerated.

The most popular cryptocurrency by market cap slumped more than $600 in 30 minutes, falling back below $10,000 on Wednesday. Today it's down 2.8%, or -$270.6, heading lower for the third day, trimming a total of 8.85%, or $920, so far this week.

Nevertheless, even after a $3,290 or 25.5% drop since its high, Bitcoin is still up $,5606 or 146.35% for the year.

There's little clarity on why the cryptocurrency started moving higher, though some credited Facebook's (NASDAQ:FB) Libra project, while others point to a rush to get in before halving, where the number of coin rewards generated will be divided by two.

The fundamentals behind Bitcoin's current plunge are equally murky. But the technicals are clear: the downside breakout of a pattern that—should the price close lower—suggests sellers have overwhelmed demand and are starting to lower their offers in order to find new buyers.
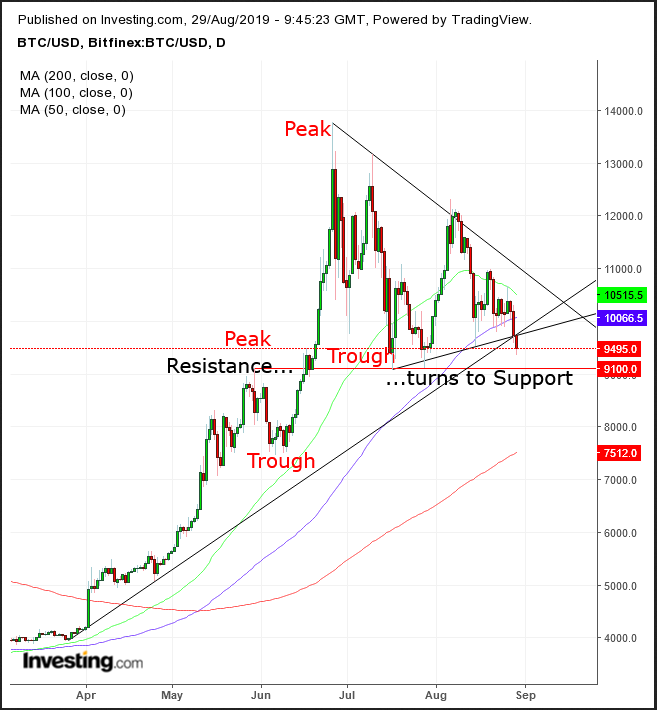
BTC Daily Chart

The price has fallen below the bottom of a symmetrical triangle. This pattern’s converging trendlines demonstrate an impasse between buyers and sellers. The downside breakout demonstrates that the stalemate has been resolved in favor of the bears.

If prices lock in below the triangle, it would be a signal that the market has synced into a coherent downtrend. Adding emphasis to this scenario: the downside breakout coincided with that of the uptrend line since late March.

The next break would be the support line between the May 30 high and the July 17 low, at $9,100. However, even then, the peak-trough succession would still be up.

Trading Strategies

Conservative traders would short after a descending peak and trough series or go long after a high above the June 26, $13,764 peak to extend the uptrend.

Moderate traders may short after the price closes below the $9,100 presumed support line.

Aggressive traders may short after a close below the triangle.

Trade Sample

  • Entry: $9,750, upon a rally
  • Stop-Loss: $10,000, to absorb a return move to the key figure
  • Risk: $250
  • Target: $9,000
  • Reward: $750
  • Risk:Reward Ratio: 1:3
  • Latest comments

    Loading next article…
    Risk Disclosure: Trading in financial instruments and/or cryptocurrencies involves high risks including the risk of losing some, or all, of your investment amount, and may not be suitable for all investors. Prices of cryptocurrencies are extremely volatile and may be affected by external factors such as financial, regulatory or political events. Trading on margin increases the financial risks.
    Before deciding to trade in financial instrument or cryptocurrencies you should be fully informed of the risks and costs associated with trading the financial markets, carefully consider your investment objectives, level of experience, and risk appetite, and seek professional advice where needed.
    Fusion Media would like to remind you that the data contained in this website is not necessarily real-time nor accurate. The data and prices on the website are not necessarily provided by any market or exchange, but may be provided by market makers, and so prices may not be accurate and may differ from the actual price at any given market, meaning prices are indicative and not appropriate for trading purposes. Fusion Media and any provider of the data contained in this website will not accept liability for any loss or damage as a result of your trading, or your reliance on the information contained within this website.
    It is prohibited to use, store, reproduce, display, modify, transmit or distribute the data contained in this website without the explicit prior written permission of Fusion Media and/or the data provider. All intellectual property rights are reserved by the providers and/or the exchange providing the data contained in this website.
    Fusion Media may be compensated by the advertisers that appear on the website, based on your interaction with the advertisements or advertisers.
    © 2007-2025 - Fusion Media Limited. All Rights Reserved.