Just days after Fed Chair Jerome Powell denigrated cryptocurrencies by calling them an unstable store of value which aren't backed by anything, Tesla founder and CEO Elon Musk added to the base case for the legitimacy of Bitcoin and peers. This morning, via Twitter, the often contrarian, always colorful CEO said customers can now buy a Tesla (NASDAQ:TSLA) using the world's most popular digital currency.
The tweet provided the digital token with an immediate 5% boost. Plus, all this is occurring just weeks after news broke that earlier this year Musk had invested $1.5 billion of his company's money in the cryptocurrency.
So, though the Fed may disagree, Musk is clearly doing his best to transform BTC into a legitimate currency. And it looks like traders are buying into the effort.

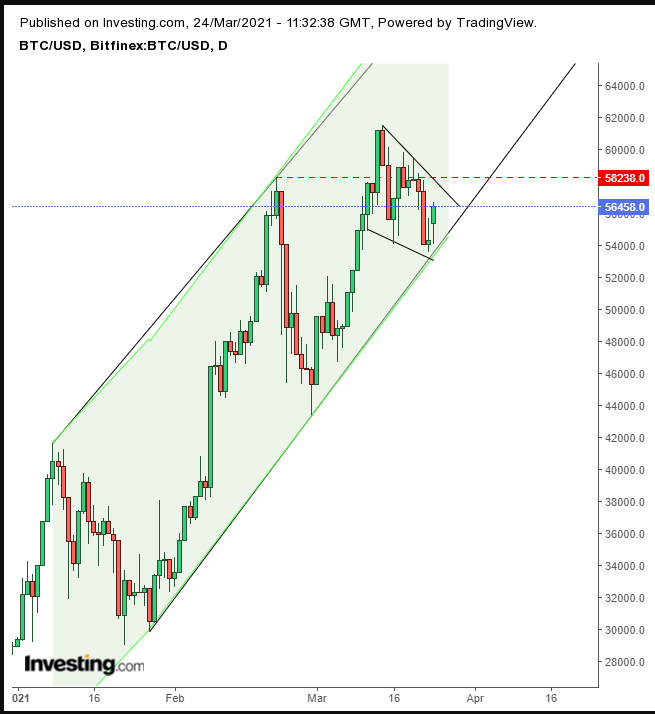
Bitcoin’s jump today confirmed the bottom of a falling flag. It's expected to prove bullish considering it’s taking a break after adding nearly a third of its value in just 9 session, from Mar. 5-13.
If the price provides an upside breakout, with a return to $60,00, that would would demonstrate that investor appetite for more Bitcoin remains strong even after available supply within the range has been gobbled up, amid profit-taking for the unbelievable move that preceded it.
Given that technical analysis seeks to find the balance of supply and demand on the asset chart, the more we see how these technical “pressure points” line up, the more it adds to the weight of the evidence, and therefore the statistical odds of a follow-through.
Observe too that the flag developed between a support and a resistance.
The top of the flag aligns with the Feb. 21 high (marked by the red, dotted line). Given that a flag is a period of rest during a trend, it makes sense that it would occur when bulls need to recuperate, in order to prepare for another attack on the bears’ stronghold.
The bottom of the flag developed into the bottom of the rising channel, which itself predicts a rebound toward the channel top.
Note: The pattern is complete only upon the flag’s completion, with an upside breakout, which can also be followed by a return-move, whipsawing bullish positions, even as those traders are right about the market’s overall direction. The flag may fail, as we’ve seen with crude oil, when its flag turned into the potential head of a H&S top. As we often say, no one knows the future. We're just navigating assumptions and trying to achieve overall positive results on a statistical basis, over many trades.
Trading Strategies – Long Position Setup
Conservative traders should wait for the market to hit news highs and develop a new, higher base.
Moderate traders would be content with an upside breakout, with at least one full, long candle above the pattern. They can then wait for a pullback for a better entry, if not for confirmation.
Aggressive traders could enter at will, provided they understand the higher risk that goes along with the desired higher reward that's part of getting in ahead of the curve. Money management is key to survival, not just for profits.
Here’s an example:
Trade Sample
- Entry: $56,000
- Stop-Loss: $53,000
- Risk: $3,000
- Target: $74,000
- Reward: $18,000
- Risk:Reward Ratio: 1:6
Which stock to consider in your next trade?
AI computing powers are changing the Canadian stock market. Investing.com’s ProPicks AI are winning stock portfolios chosen by our advanced AI for Canada, the US, and other exciting markets around the globe. Our top strategy, Tech Titans, nearly doubled the S&P 500 in 2024 - one of the most bullish years in history. And Beat the TSX, designed for broad market exposure, is showing +878% gains with 10 years’ back-tested performance. Which Canadian stock will be the next to soar?
Unlock ProPicks AI
