Breaking News
Get 45% Off 0
🌊 NVIDIA ripple effect: Track AI stocks' response to chip giant's earnings
Explore AI Stocks

Chart Of The Day: Demand For USD/JPY Offsets Macro Drivers

By Investing.com (Pinchas Cohen)CurrenciesJul 23, 2018 10:01
ca.investing.com/analysis/chart-of-the-day-demand-for-usdjpy-offsets-macro-drivers-200197334
Chart Of The Day: Demand For USD/JPY Offsets Macro Drivers
By Investing.com (Pinchas Cohen)   |  Jul 23, 2018 10:01
Saved. See Saved Items.
This article has already been saved in your Saved Items
 
 
USD/JPY
-0.11%
Add to/Remove from a Portfolio
Add to Watchlist
Add Position

Position added successfully to:

Please name your holdings portfolio
 
USD/CHF
-0.06%
Add to/Remove from a Portfolio
Add to Watchlist
Add Position

Position added successfully to:

Please name your holdings portfolio
 
XAU/USD
-0.49%
Add to/Remove from a Portfolio
Add to Watchlist
Add Position

Position added successfully to:

Please name your holdings portfolio
 
DX
+0.13%
Add to/Remove from a Portfolio
Add to Watchlist
Add Position

Position added successfully to:

Please name your holdings portfolio
 
Gold
-0.74%
Add to/Remove from a Portfolio
Add to Watchlist
Add Position

Position added successfully to:

Please name your holdings portfolio
 

Donald Trump's dollar bashing has boosted the yen and traders today bid up the Japanese currency on speculation that the Bank of Japan might finally begin scaling back its sizeable quantitative easing program. The yen, however, gave up its three-day climb later on Monday—pressured lower by a technical driver, rather than any known fundamental reason.
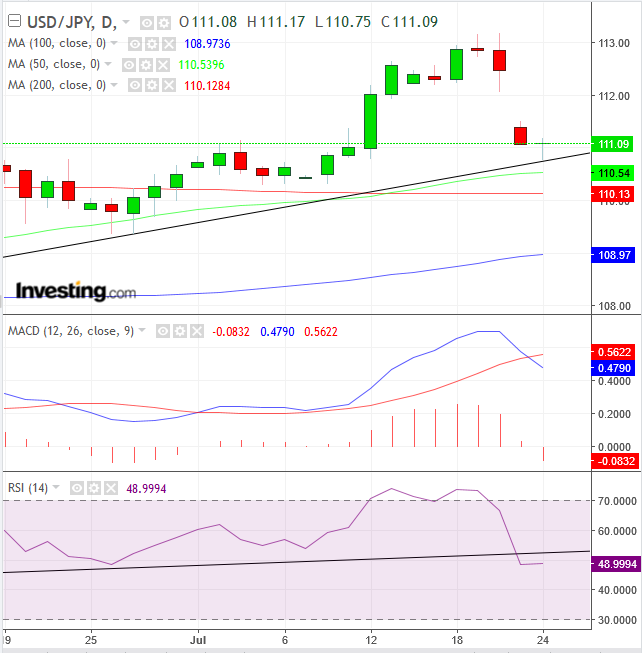
USD/JPY Daily Chart
USD/JPY Daily Chart

When the price touched the uptrend line since late March, it drew back, revealing demand patiently waits by the technical level. Below, the 50 DMA "guards" the uptrend line, after crossing above the 200 DMA last week and triggering a golden cross, considered a very bullish indicator.

On the other hand, both the MACD and the RSI provided sell signals. The MACD’s shorter MA (blue) crossed below the longer MA (red), as current prices fall relative to older rates. The RSI tracks momentum, suggesting prices may lower, as well.

However, the rebound on top of the uptrend line confirms the trend. Should the price close at these levels, they would form a hammer, another bullish indicator. Traders say that a bottom has been “hammered out,” expecting a rally to follow. Note, the price may retest the hammer’s support before it presumably takes off.

Why would there be demand at these technical levels? Probably for a double USD dynamic: the dollar rises during both risk-off AND risk-on.

  1. The greenback replaced the yen, the Swiss franc and gold, as the ultimate safe-haven asset, as it did in the 2008 financial crash.

  2. The widening gap between the two countries' interest rates means traders earn a higher yield for holding the dollar against the yen.

Trading Strategies – Long Position Setup

Conservative traders would wait for a new peak to be posted, to confirm the uptrend.

Moderate traders may enter a position after a follow-up candle successfully retests its support.

Aggressive traders may risk a long entry upon a close above 111.10, providing they can afford a stop-loss below the hammers’ 110.75 low or predetermine how much they’re willing to risk on this position within the overall management of their account.

Equity Management

Trading can be called a profession when carried out based on specific rules. Taking a trading position based on impulsive decisions is gambling, and unfairly gives the business a bad name.

A professional trader sets out an equity management plan according to the three variables: his own temperament, equity and time.

Losing trades is the costs of doing business. If a trader doesn’t keep costs down, he’ll go out of business. Therefore, only “buy” bargain trades, with a minimum of 1:3 risk-reward ratio, based on the trades’ outlook. If not, wait for it. You don’t make money for entering trades, only when you profit. A favorable risk-reward ratio provides you with an overall statistical advantage.

Chart Of The Day: Demand For USD/JPY Offsets Macro Drivers
 

Related Articles

Monex
Mixed tariff risks keep markets off balance By Monex - Feb 27, 2025

CAD While the loonie has not fully unwound the recent move lower on the back of Trump’s comments yesterday, it is notable that USDCAD has begun early trading this morning with a...

Chart Of The Day: Demand For USD/JPY Offsets Macro Drivers

Add a Comment

Comment Guidelines

We encourage you to use comments to engage with users, share your perspective and ask questions of authors and each other. However, in order to maintain the high level of discourse we’ve all come to value and expect, please keep the following criteria in mind: 

  • Enrich the conversation
  • Stay focused and on track. Only post material that’s relevant to the topic being discussed.
  • Be respectful. Even negative opinions can be framed positively and diplomatically.
  •  Use standard writing style. Include punctuation and upper and lower cases.
  • NOTE: Spam and/or promotional messages and links within a comment will be removed
  • Avoid profanity, slander or personal attacks directed at an author or another user.
  • Don’t Monopolize the Conversation. We appreciate passion and conviction, but we also believe strongly in giving everyone a chance to air their thoughts. Therefore, in addition to civil interaction, we expect commenters to offer their opinions succinctly and thoughtfully, but not so repeatedly that others are annoyed or offended. If we receive complaints about individuals who take over a thread or forum, we reserve the right to ban them from the site, without recourse.
  • Only English comments will be allowed.

Perpetrators of spam or abuse will be deleted from the site and prohibited from future registration at Investing.com’s discretion.

Write your thoughts here
 
Are you sure you want to delete this chart?
 
Post
Post also to:
 
Replace the attached chart with a new chart ?
1000
Your ability to comment is currently suspended due to negative user reports. Your status will be reviewed by our moderators.
Please wait a minute before you try to comment again.
Thanks for your comment. Please note that all comments are pending until approved by our moderators. It may therefore take some time before it appears on our website.
 
Are you sure you want to delete this chart?
 
Post
 
Replace the attached chart with a new chart ?
1000
Your ability to comment is currently suspended due to negative user reports. Your status will be reviewed by our moderators.
Please wait a minute before you try to comment again.
Add Chart to Comment
Confirm Block

Are you sure you want to block %USER_NAME%?

By doing so, you and %USER_NAME% will not be able to see any of each other's Investing.com's posts.

%USER_NAME% was successfully added to your Block List

Since you’ve just unblocked this person, you must wait 48 hours before renewing the block.

Report this comment

I feel that this comment is:

Comment flagged

Thank You!

Your report has been sent to our moderators for review
Continue with Apple
Continue with Google
or
Sign up with Email