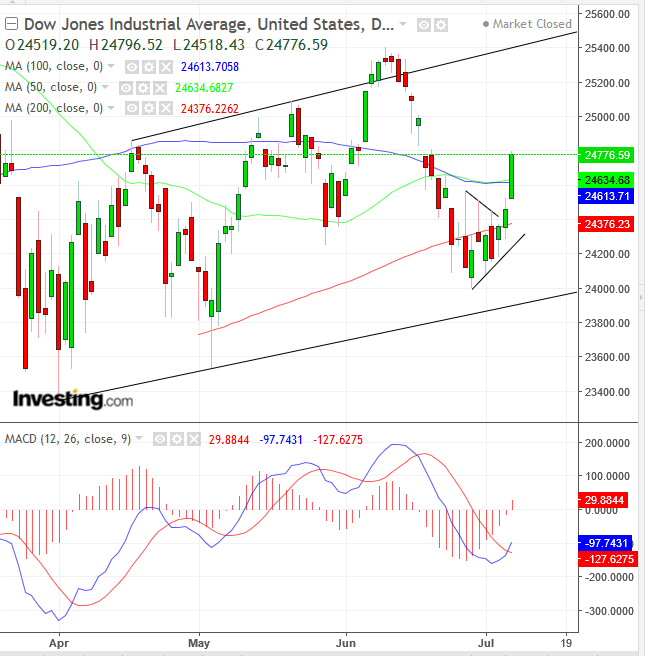
US stocks rallied yesterday, with the recent underdog, which had been pummeled by trade war jitters, the Dow Jones Industrial Average, outperforming other major benchmarks. Since the multinational mega caps listed on the Dow rely heavily on exports for continued growth, it's a sign investors have moved on, relegating their tariff concerns to the back burner, now focusing instead on the economy and company profits.
The Dow was especially bullish. It closed at the height of the session, demonstrating there was no bearish resistance in sight.

The 30 stock index triggered multiple technical signals as well:
- The Dow blew out a pennant pattern, which had been developing since late June, presumed bearish after the preceding 5.5 percent plunge, from June 11 to June 28. The reversal flipped the market dynamic, as bears were forced to cover shorts, increasing demand; thus encouraged, bulls added to positions. Speculators, recognizing the reversal, also jumped on board.
- The price climbed back above the most watched, 200 DMA (red) and proceeded to penetrate both the 50 DMA (green) and 100 DMA (blue).
- The reversal confirmed a rising channel
- And finally, the MACD provided the best buying signal since early April, off the lowest prices since November, as the shorter MA (blue) crossed above the longer MA (red), after its most oversold condition since the April bullish MA crossing.
Trading Strategies – Long Position Setup
Conservative traders would wait for a confirmation of the primary uptrend, when prices climb above the January 25, 26,616.71 record
Moderate traders may enter a position if the price successfully retests the channel bottom, or at least the pennant failure, now presumed to be a ground zero for demand.
Aggressive traders may go long now, providing their overall trading strategy allows for a stop-loss below the 24,300 pennant and 200 DMA support, if not below the 24,000 channel-bottom support. Alternatively, they might risk a closer stop-loss, below the 24,600, 100 DMA (blue) level.
Equity Management
Formulating a trading plan, to include equity management, both for the entirety of the holding, as well as per trade, is as important – if not more so – than the analysis itself. In order to increase statistical returns, enter only positions that provide a risk-reward ratio of 1:3 at the minimum.
Trade Examples:
Conservative:
- Entry: 25,600
- Stop-loss: 25,500 Risk: 100 points
- Target: 25,900 Reward: 300 points Risk-Reward Ratio: 1:3
Moderate:
- Entry: 24,400
- Stop-loss: 24,300 Risk: 100 points
- Target: 24,700 Reward: 300 points Risk-Reward ratio: 1:3
Aggressive:
- Entry: 24,700
- Stop-loss: 24,600 Risk: 100
- Target: 25,000 Reward: 300 Risk-Reward ratio: 1:3
Which stock to consider in your next trade?
AI computing powers are changing the Canadian stock market. Investing.com’s ProPicks AI are winning stock portfolios chosen by our advanced AI for Canada, the US, and other exciting markets around the globe. Our top strategy, Tech Titans, nearly doubled the S&P 500 in 2024 - one of the most bullish years in history. And Beat the TSX, designed for broad market exposure, is showing +878% gains with 10 years’ back-tested performance. Which Canadian stock will be the next to soar?
Unlock ProPicks AI