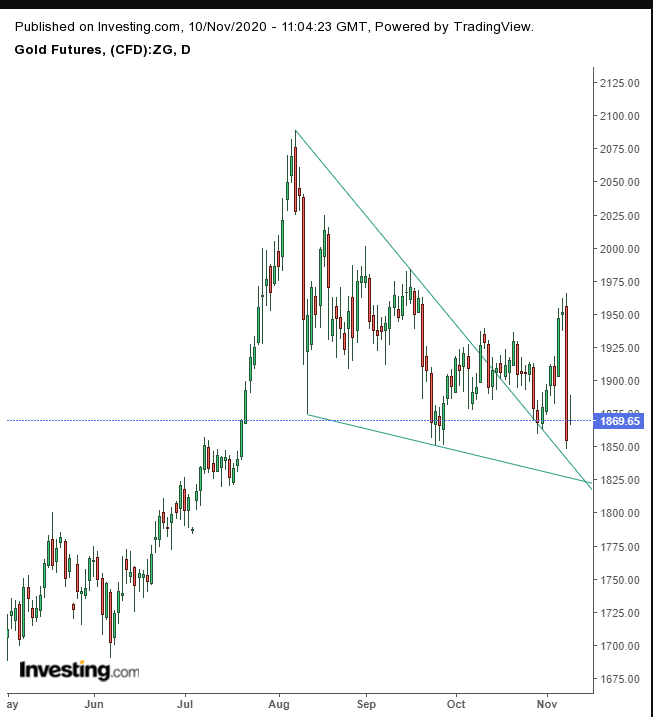
On Monday, gold registered its biggest move in more than seven years—it dropped a whopping 5%. In just one session the precious metal toppled from a three-week high to a four-month low.
The fundamentals that drove this drastic move were equally dramatic. The catalyst was news from drugmaker Pfizer (NYSE:PFE) of a breakthrough in its pursuit of a coronavirus vaccine. The big pharma company said its experimental treatment was more than 90% effective in a late stage trial. Pfizer and its German partner BioNTech (NASDAQ:BNTX) expect to seek US emergency use authorization before the month is out.
After recent setbacks pressured other biotech competitors, the positive news from Pfizer vaulted investors back into risk assets as they imagined a world already heading back to normal, without the fear associated with the worst global pandemic in one hundred years. Concurrently, they dumped safe haven assets, a key investment role for gold.
The yellow metal's technicals, however, seem to be signaling there's still a persistent demand for gold, and that yesterday’s move was nothing more than a knee-jerk reaction. That fits with the ongoing state of an array of other fundamentals.
For starters, the COVID-19 pummeled global economy remains in considerable need of support. Second, only 50 million doses of the Pfizer vaccine will be available once it passes regulatory requirements. That, of course, won't be enough to protect everyone worldwide, which means the end of the virus isn't nearly as close as markets first assumed and a return to the old normal isn't necessarily at hand.
Finally, over recent months, risk assets have been driven up mostly by continuous QE and historically low interest rates. So the market narrative appears to have overlooked the possibility that gold will likely receive substantial support as a hedge against currency devaluation, which is what will happen with continued QE and super low rates.
As such, yesterday’s move could be considered nothing more than a mistake. Smart traders should take note.

Despite the yellow metal's worst selloff in years, there was sufficient demand to provide support above the falling wedge—bullish, following the uptrend—as it cleared all the supply and provided an upside breakout, signaling a resumption of the underlying uptrend.
Trading Strategies
Conservative traders would wait for the price to migrate above $1,975, for evidence that all the supply has been absorbed and demand remains intact.
Moderate traders may take a long position with another normal, long candle, demonstrating support.
Aggressive traders are likely to risk a contrarian, long position right now, to take advantage of an exceptionally favorable risk-reward ratio. However, they must have in place a tight trade plan with which to keep control of their risk and reward. Here’s an example.
Trade Sample
- Entry: $1,868
- Stop-Loss: $1,848, yesterday’s low
- Risk: $20
- Target: $1,968, above yesterday’s highs
- Reward: $100
- Risk:Reward Ratio: 1:5
- Secondary Target: $2,068 – below all-time high on Aug. 7
- Reward: $200
- Risk:Reward Ratio: 1:10
