Much has been written about how advertising dollars have been drying up during the coronavirus pandemic. That's a primary reason Alphabet's (NASDAQ:GOOGL) earnings disappointed last week.
At the same time the parent company of Google reported, Facebook (NASDAQ:FB)—which is also heavily dependent on ad spending and has been the target of a highly publicized advertising boycott—released results too, but the social media giant surprised to the upside.
The reason Google’s advertising funnel is drying up during this pandemic while Facebook’s ad revenues continue to grow is this: Google's AdWords system relies on user searches to find products or services whereas Facebook targets users and shows them ads based on their interests.
A Google search may be more effective in the short-term and lead to an actual sale, but Facebook's targeted approach enhances a brand’s influence over the longer term while building a loyal base fan, leading to overall higher growth over an expanded period of time.
Technicals are echoing these business models.

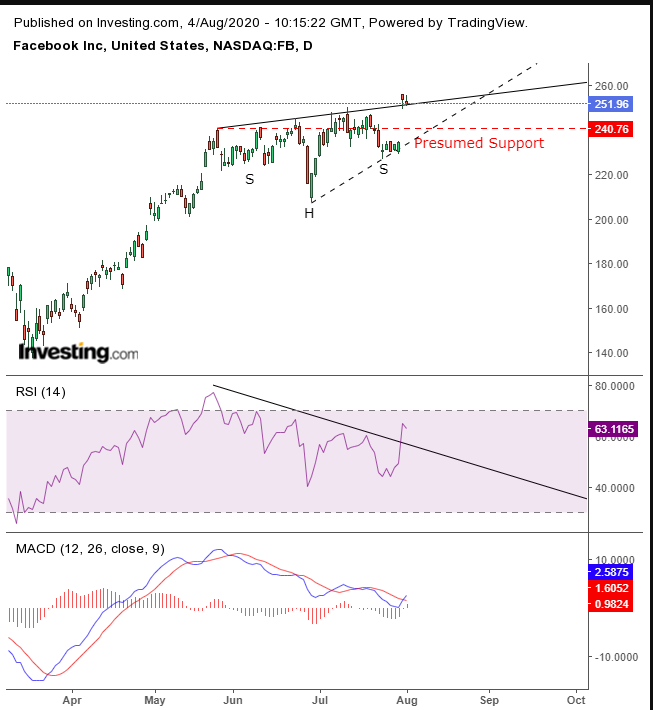
GOOGL topped out last week when it was sold off after its earnings release. On the other hand, Facebook completed a bullish, H&S continuation pattern post-earnings when the stock soared. Both the RSI and MACD supported the reversal.
Beware, however, of Friday’s hanging man, which occurs when a presumed short squeeze pushes prices higher. This was confirmed by Monday’s lower close.
This is bearish, and increases the chances of a pullback. However, the preceding breakaway gap should be able to absorb a bearish counterattack.
Point of Interest: Some analysts may argue that the pattern is a rising wedge (dotted line as bottom), which is bearish. While the upside breakout has the potential to be a fakeout, the dynamics that generally lead to the selloff following a rising wedge are in place if the pattern follows a downtrend. This one, however, is within an uptrend.
Also, the RSI and MACD demonstrate that both momentum and price outlook support the upside breakout, except for the one caveat we provided in our bullish scenario of the confirmed hanging man.
Therefore, pay close attention to the following section and find your place within the various trading options.
Trading Strategies
Conservative traders would wait for the hanging man’s blowout, with a close above the $260 round number, which would include a minimum 3% price/3 day penetration of the H&S neckline, (preferably, to include a weekend), reducing the chances of a bull trap.
Moderate traders would be content with seeing the price break the hanging man’s purported resistance—on a closing basis—which would also include a 2% price/2 day filter, reducing the chances of a false breakout.
Aggressive traders may enter a contrarian, short position—provided they get the timing right—riding a presumed decline, to “fill-in-the-gap” (a mythical presumption), before joining the market with a long position.
Trade Sample – Aggressive, Contrarian Short Position
Entry: $255 – as the price retests the hanging man’s resistance
Stop-Loss: $256
Risk: $1
Target: $250 – psychological round number and neckline support
Reward: $5
Risk:Reward Ratio: 1:5
Note: This is just a trade sample. It doesn’t possess any magical powers. We are not prophets. We are simply relaying how aggressive traders may manage this trade – which they may lose - and provided the basic components of a coherent trade plan. If you don’t understand the post and the inherent risk of this trade, you’re not trading but gambling.
Feel free to customize the trade according to your budget, temperament, and timing.
Alternative Examples
- if you have the patience and risk threshold, you can target $145 to double the potential reward.
- If you’re concerned about missing the short, enter before waiting for such an ideal entry, at the risk of increasing exposure.
