The Director General of the World Health Organization, Tedros Adhanom Ghebreyesus, warned on Monday that the pandemic is “a long way from over,” due to confusion and complacency. According to WHO's assessment, the trajectory of COVID-19 is now “growing exponentially, with over 4.4 million new virus cases last week. Naturally, that only increases global demand for the vaccine.
Among the companies whose innocultions are already available and in use, including Moderna (NASDAQ:MRNA), AstraZeneca (NASDAQ:AZN) and Johnson & Johnson (NYSE:JNJ), Pfizer's vaccine appears to be the clear leader in the race to increase market share.
That's because recent clinical trials demonstrated the Pfizer (NYSE:PFE) shot is safe and effective for the 12-15 year old cohort as well as for those 16 and older who are currently receiving it. Which positions Pfizer’s vaccine to receive FDA emergency use authorization for younger adolescents, months ahead of the competition—before schools open in the fall.
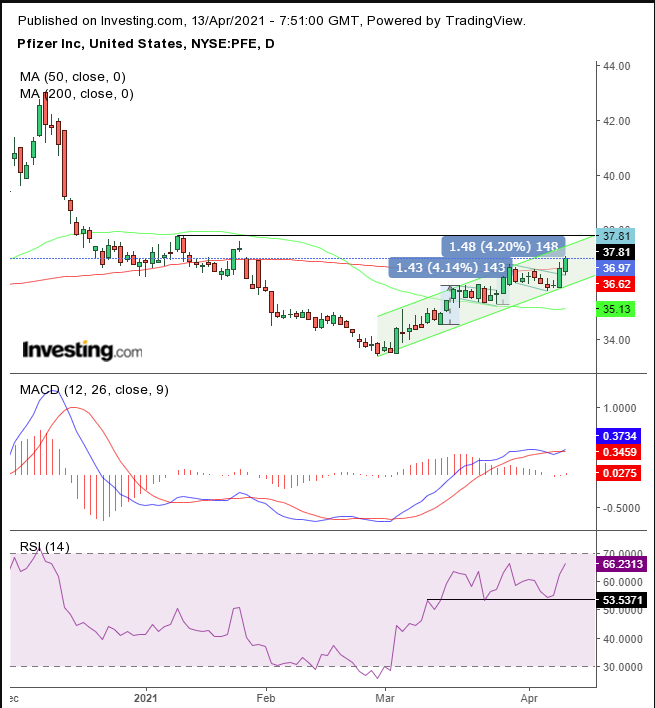
The technical perspective for Pfizer stock also broadcasts its leadership, after PFE completed back-to-back bullish patterns.

Pfizer extended an upside breakout of the second consecutive falling flag, bullish after sudden and sharp preceding increases. The flagpole, which was formed by the rapid almost straight up movement, caught traders unaware. In turn, they became suspicious of too-good a trade.
So they locked-in profits, then waited for further developments. Still, despite their positions unwinding, there was sufficient demand to pick up the slack. That supported the price and prevented an actual decline.
When demand absorbed all available supply within the range, buyers upped their bids to find new willing sellers at higher prices. It's a signal these buyers are serious about their positions and are willing to put up additional money to prove it. Moreover they showed they were hungry for yet more.
This spurred renewed appetite for early bulls who'd already sold off their positions, while also causing them to doubt their initial instincts to cash out. They're now covering, which is pushing the price even higher, and in the process, also finally attracting remaining, undecided investors. As such, the supply-demand scale is expected to tilt in favor of demand, which will catapult the price even higher.
Notice the symmetry of the repeated patterns. The flagpoles are nearly identical, with the first rising $1.43 and the second $1.48. Therefore, the current breakout is expected to extend for the same distance—at minimum. With a $0.55 jump from the top of the flag, there's almost another two-thirds yet to go.
This will increase if the price performs a return move, retesting the demand of the pattern. We can also see how symmetrical the pattern is, as it forms a rising channel.
After the price found resistance on Friday precisely at the 200 DMA—after piercing it on an intraday basis, but ultimately closing exactly below it—it shot through the resistance to start the new week.
The MACD’s short MA climbed back above the long MA, and the RSI is set to blow out a potential top, which tends to propel prices even higher.
Both fundamentals and technicals provide the outlook for the stock to rise. However, we expect that the previous $37.80 high on Jan. 11 will provide at least a temporary resistance. If the price makes it through, we anticipate it will keep going higher and retest the December, $43 peak.
Trading Strategies
Conservative traders should wait for the price to overcome the $38 level and find a new floor before trusting the current uptrend.
Moderate traders would be content with a 2% breakout to $37.2 and a two-day period in which the price remains above the pattern.
Aggressive traders could trade at will, provided they understand and accept the risk of a premature entry, to capture a bigger part of the move. The higher risk makes a trade plan all the more important.
Here’s an example:
Trade Sample
- Entry: $37
- Stop-Loss: $36
- Risk: $1
- Target: $43
- Reward: $6
- Risk:Reward Ratio: 1:6
