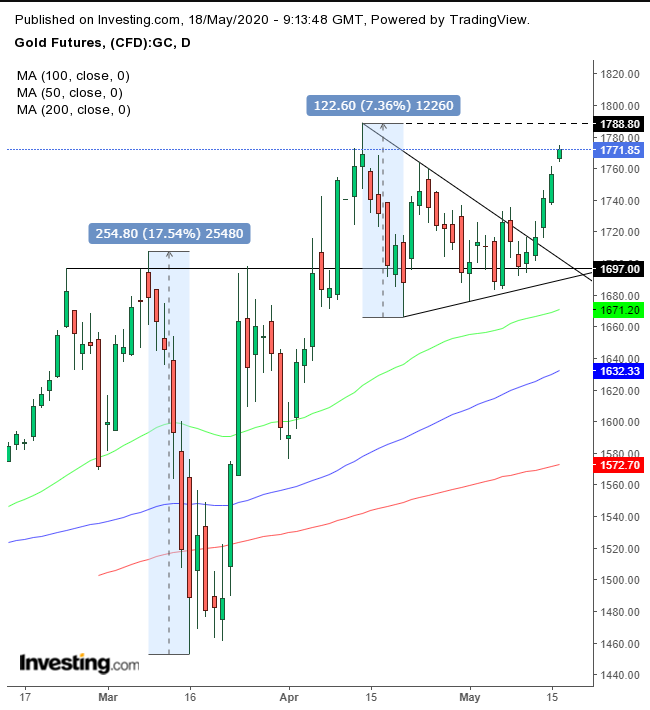
Gold jumped to a seven-and-half year high on Friday, after the Fed warned investors that stocks may drop if the coronavirus pandemic gets worse.
Then, on Sunday, the central bank chief, Jerome Powell forecast on CBS’s 60 minutes that the economic fallout could last at least till the end of the next year—a minimum of another 18 months.
Gold prices popped today, rising 0.6%. At the same time, S&P 500 futures opened 0.8% higher.
Why would a safe haven stalwart and an array of risk assets both strengthen in unison? The dollar's weakening versus commodity currencies paved the way for a gold rally, even as equities were boosted by California—the largest state economy within the largest global economy—announcing it will reopen most of its businesses today.
Though the yellow metal is up for a fifth straight day, a gap after such a long advance may be prime positioning for a pullback, at least according to the principles of technical analysis.

A gap after a long advance demonstrates excitement. While intuitively that sounds positive for demand, it could also be a blow for traders if they don’t see follow-up demand, in this case in the form of higher prices. Should that occur it would be the perfect set up for an Evening Star—a bearish three-day reversal pattern—right below the resistance of the April 14 high.
However, such a scenario should only play along with the mechanism of the symmetrical triangle that preceded the rally. The price would retest the pattern’s integrity, and provided that demand would in fact be waiting to pick up gold for a discounted price to today’s going rate, gold would repeat the same $120 move that created the triangle, from the $1,715 breakout point, acquiring a $1,835 target.
However, we have a second, more ambitious price objective of $1,945, arrived at by measuring the height of the preceding, H&S continuation pattern and adding it to its point of breakout.
Trading Strategies
Conservative traders should wait with a long position for the return move and the bounce that signifies support.
Moderate traders would wait for the same pullback, but for a better entry, not necessarily for confirmation.
Aggressive traders might enter a contrarian trade, on the likelihood of a temporary reversal, based on our interpretation of the current supply-demand mechanism. Note: We, nor anyone on earth, can know whether this scenario will play out. Therefore, only enter such trades if you are prepared to lose the trade and write the trading plan accordingly.
Trade Sample – Contrarian Short Position
- Entry: $1,775 – the day’s high
- Stop-Loss: $1,790 – April 14 high
- Risk: $15
- Target: $1,730 – above the congestion since April 28
- Reward: $45
- Risk:Reward Ratio: 1:3
Disclaimer: This is just a trade sample. We don’t know whether it will win. Do not trade it unless you’re OK with losing the trade. Our sample is for educational purposes only.
