Gold has recently lost its safe-haven shine to the dollar, which is benefiting from the security of the U.S. economy, as well as a growing favorable interest rate differential.
However, yesterday’s USD selloff on heightened geopolitical risk played out according to pre-trade-war rules, though it may prove to be a one-off occurrence. Either way, investors rotated into the yen, which has fared as the world's favorite safe-haven asset over the last couple of years, while gold posted a subdued performance.
Has the yellow metal lost its luster? So far, billionaire investor Ray Dalio either doesn’t think so or is unwilling to liquidate losing positions. His hedge fund accounts for 3.9 million shares in the world's largest bullion-backed ETF, SPDR Gold Shares (NYSE:GLD), as well as for 11.3 million shares in the iShares Gold (NYSE:IAU), the second largest.
But further drops in the precious metal will presumably mark a breaking point for Dalio, who would be forced to cut losses. While liquidating an ETF wouldn't directly impact gold, the news of the last major bull turning a cold shoulder to the commodity could severely affect trader sentiment.

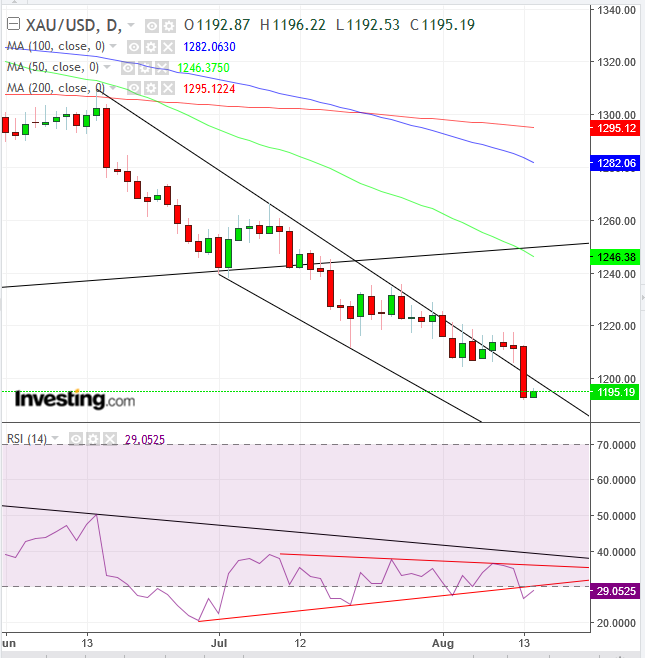
XAU/USD has fallen for nine out of ten weeks, crossing below its long-term uptrend line since November 2015, forming a descending channel.
The primary three moving averages are in bearish formation, with the shorter MAs below the longer ones.
At above 25, the current indicator is the most oversold weekly RSI since June 2014. The daily RSI has just provided a downside breakout, completing a symmetrical triangle, bearish in a downtrend.
Trading Strategies – Short Position Setup
Conservative traders might either wait for the price to break the previous, December 2016 long-term trough, which touched the long-term uptrend line at $1,122.44, to confirm the downtrend or for the price to successfully retest the broken long-term uptrend line, currently at the $1,250 levels. A trough lower than the one before the return move would confirm the downward reversal.
Trade Sample: Upon forming a new low after the return to the broken uptrend line
- Entry: $1,190, forming a new low in the new downtrend
- Stop-loss: $1,210, August’s broken support, now presumed resistance
- Risk: $20
- Target: $1,125, psychological round number above the December 2016 trough
- Reward: $65
- Risk-Reward Ratio: 1:3
Moderate traders may wait for a return to the uptrend line, for a better entry, but not necessarily for proof of the new downtrend.
Trade Sample: Upon returning to the broken uptrend line
- Entry: $1,250
- Stop-loss: $1,260
- Risk: $10
- Target: $1,200
- Reward: $50
- Risk-Reward Ratio: 1:5
Aggressive traders could risk a short position with a return to the $1,220 level, where a previous support-turned-resistance would presumably cause supply to pressure prices back down.
Trade Sample: Upon return to July-August support/resistance level
- Entry: $1,220
- Stop-loss: $1,225
- Risk: $5
- Target: $1,190
- Reward: $30
- Risk-Reward Ratio: 1:6
