Right now, market incongruities are increasing on what appears to be three levels:
1. On Wednesday, both the S&P 500 and NASDAQ Composite each notched new record highs, yet demand for Treasurys also grew. That's counterintuitive. Investors tend to flee to bonds during times of fear, which obviously shouldn't be the case when equities, which are popular risk assests, just set fresh records.
2. Rising Treasurys boost the dollar, a necessity for global investors wishing to purchase U.S. sovereign bonds. A stronger USD makes assets priced in dollars, such as gold, more expensive. Thus the greenback and the yellow metal are normally negatively correlated, meaning when one goes up the other generally goes down. The same negative correlation usually exists for equities and Treasurys.
3. When investors are feeling emboldened, they buy equities. When they're fearful, they shift into safe havens such as gold and Treasurys. But right now all three asset classes are moving higher in tandem. That shouldn't happen.
Nonetheless, gold hit a 7-year high today, even as the dollar is at a two-and-half year high and U.S. equity indices are at or near their own record levels.
How is this contradiction—that both risk-on and risk-off assets are rising simultaneously—even possible?
It could be we're seeing the same investors driving shares sky-high on central bank accommodation, though they don't trust the cheap money will last, so they're hedging. Or we’re witnessing a strategy disagreement between investors; some are going all-in on stocks while others are steadfast on Treasurys and gold.
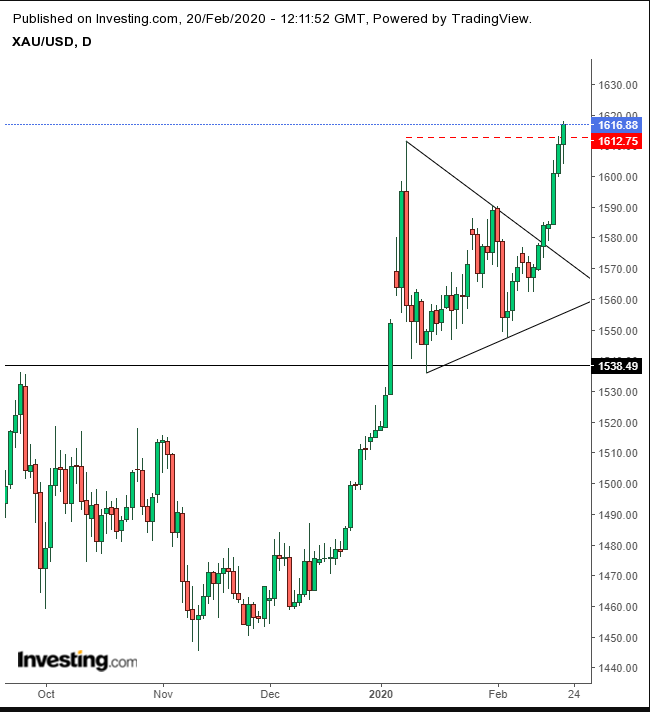
Whatever the case, one thing looks certain—technicals are signaling that gold is in a position to keep climbing.

Gold is up for a seventh straight day, extending the penetration of an upside breakout to a bullish pennant, on top of 2019 highs. Which marks these levels as a crucial line within the supply-demand balance.
The upside breakout demonstrates empirically that buyers have sucked up all of the available demand within the pattern are now venturing to higher ground, in search of new sellers.
Having reached the January highs, coupled with an upside breakout that hasn't quit, even after a 7-day rally, we could expect a return move to retest the pattern’s integrity before the yellow metal returns to higher highs.
Trading Strategies
Conservative traders should wait for a full return move, that bounces off the very top of the pattern, demonstrating market mechanics are in place to resume the underlying uptrend, before committing to a long position.
Moderate traders would wait for a pullback for a better entry, not necessarily for any further proof of the rallies to come.
Aggressive traders may enter a contrarian, short position, counting on the pullback and the January highs as resistance, risking a small stop-loss, before joining the rest of the market with a long position.
Aggressive Trade Sample
- Entry: $1,617
- Stop-Loss: $1,618
- Risk: $1
- Target: $1,600
- Reward: $17
- Risk:Reward Ratio: 1:17
Which stock should you buy in your very next trade?
With valuations skyrocketing in 2024, many investors are uneasy putting more money into stocks. Unsure where to invest next? Get access to our proven portfolios and discover high-potential opportunities.
In 2024 alone, ProPicks AI identified 2 stocks that surged over 150%, 4 additional stocks that leaped over 30%, and 3 more that climbed over 25%. That's an impressive track record.
With portfolios tailored for Dow stocks, S&P stocks, Tech stocks, and Mid Cap stocks, you can explore various wealth-building strategies.

