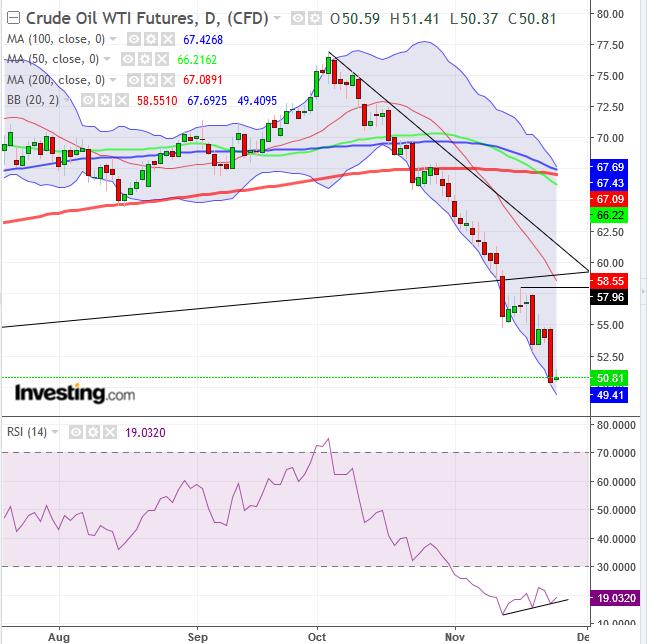
Oil bounced this morning, after slumping 6.66% on Friday, the worst day for the commodity in three years.
However, prior to Friday's plunge, oil was already in a bear market, its price having been in steady decline since late October, the longest losing streak for WTI on record. Today's bounce may have traders asking themselves hopefully if this reversal might be the start of some good news for oil, after weeks of relentlessly negative headlines.
We're not so optimistic. Nothing has changed in oil markets, neither fundamentally nor technically. Our bearish outlook still stands.
Fundamentally, supply has steadily increased, while demand is expected to continue to decrease, along with slowing global economic growth due to US President Donald Trump's ongoing trade war with China. As well, both China’s and Germany’s economies are already slowing. Then of course, there's Trump's very visible efforts, via Twitter, to force the Saudi's hand in pushing oil prices down further.
All the while, in the background there's the aging, longest-running equity bull market on record, alongside a late business cycle and rising interest rates. The latter should also boost the dollar, which would be another headwind for oil prices. So where might oil prices go from here?

Technically, oil has been in an official bear market after falling 20 percent since its October 3, $76.90 high. It's now more than 33 percent from this top.
The commodity's 50 DMA crossed below the 200 DMA executing a death cross, a technical milestone that's even acknowledged by fundamental analysts. On the weekly scale, the price fell below the 200 WMA.
However, since the descent was so hard—with the slide occurring over 7 straight weeks—there was no opportunity for the price to form the required descending peaks and troughs to establish a long-term downtrend. This requirement for calling a long-term downtrend isn’t purist or arbitrary.
Rather, there are essential dynamics at play. From a technical perspective, falling peaks and troughs demonstrate that all the stop-loss, orders and short squeezes have been triggered and the way is now clear for the trend to continue its path. From a psychological standpoint, it means that wayward bulls were punished for their errant ways and are now presumably out of the game, while bears have been rewarded for their sound judgement and are encouraged to press harder. Note that bulls may also convert to bears, adding their weight on the price.
However, this doesn’t mean that the overwhelmingly pessimistic outlook doesn’t provide some contrarian opportunities. Short sellers could still take profits, reducing supply. Risk-takers might want to stick a toe in the icy water to see how deep the floor is, by trying small long-positions. Finally, the $50 level is a key psychological number, likely to gain much attention and attract demand.
There are a few technical indicators that support the bounce, albeit a small one. RSI is in an uptrend in momentum, as it posted two rising peaks and troughs. The Bollinger® Band has been cruelly stretched downward for over a month, and the convergence of the three major moving averages often signals volatility, which after a decline suggests an upward movement.
Trading Strategies
Conservative traders should wait for the long-term trend to realign with the medium-term trend, with either the medium-term scaling above the October high, or with the long-term trend registering a descending peak-trough series.
Moderate traders may short the medium-term trend, after a correction toward the $60 level, where a confluence of resisting technical factors emerge, including the round psychological number, the broken long-term uptrend line and the medium-term downtrend line since the October high.
Trade Sample:
- Entry: $57.50, resistance at the corrective peak of November 16
- Stop-loss: $60, the resistance confluence described above
- Risk: $2.50 – admittedly bigger than most of our previous exposures, but since the overwhelming evidence is for prices to go down, we don’t want to lose a position for a “cheap” stop-loss.
- Target: $50, psychological round number.
- Risk-Reward Ratio: 1:3
Aggressive traders may risk a long position, in case of a pullback, as the market forces realign after a potentially exaggerated move. Then, they may join the short position described in the moderate section.
Trade Sample:
- Entry: $51
- Stop-loss: $50, below yesterday’s low and a round psychological number
- Risk: $1
- Target: $55, November 13-19 support, turned resistance on November 21-23.
- Reward: $5
- Risk-Reward Ratio: 1:3
