Home Depot's Q1 2020 earnings release on Tuesday before the open wasn't straightforward. The home improvement retailer's results beat on revenue and same-store expectations, but they disappointed on profits.
Shares of Home Depot (NYSE:HD) sold off afterward, finishing at $238.10, down 3%, wiping out Monday’s +2% surge, and then some.
The Atlanta-based chain enjoyed increased sales. It was among the few retailers allowed to remain open amid COVID-19 lockdowns, driving customers to its stores. Still, profits were down.
The company blames the pandemic, citing expenses from additional sanitation, expanded time off, more employee bonuses and extended healthcare benefits for workers and their families. Traders weren't impressed by the retailer's largess toward employees or customers.
We believe there's another reason for the selloff. Home Depot joined the trend of suspending guidance during the global pandemic. Not only is that a crucial tool analysts use to form an educated opinion about the appropriate course of action regarding a company’s stock, it also tarnishes the rosy view investors have been working hard to develop.
If the company itself isn't confident enough to formulate an outlook, how can investors presume to know what to expect? The fact that more and more companies are skipping a crucial piece of their earnings report is making it incrementally more difficult for analysts and investors to formulate a positive outlook on these companies and not feel silly about having very little to substantiate their optimism.
On the other hand, there's painful precedent for providing disappointing guidance: for example, Walmart's (NYSE:WMT) negative guidance was responsible for the December 2016, near-20% selloff of its stock, despite the company consistently beating expectations as a rule.
If Home Depot's fundamentals aren't encouraging, the balance of supply and demand could be painting an even more dire picture—investors might be scaling back on their optimistic views.

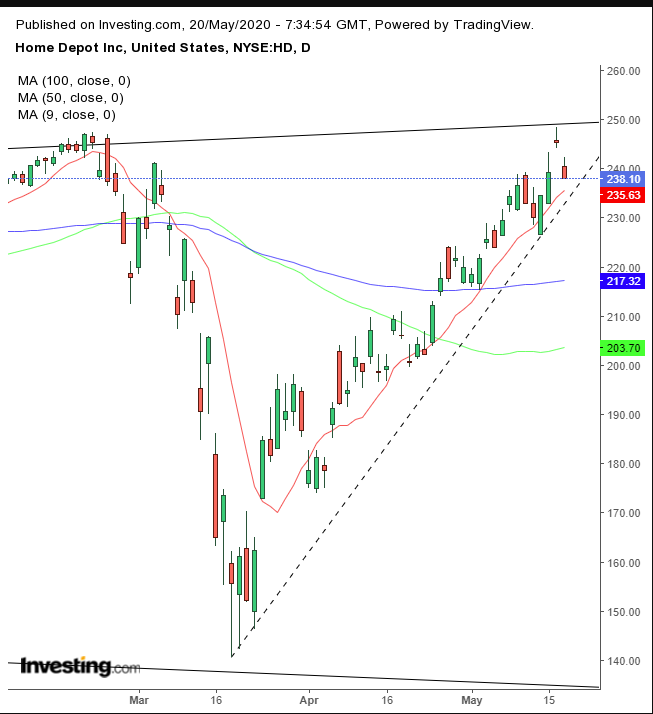
Yesterday’s 3% plunge completed an Evening Star–a three-candle bearish formation, demonstrating a reversal, as initial bullishness seems, in retrospect, to have been misplaced. The clean gap between the second candle and the others increases the forcefulness of the reversal, as the determination of bears matched the equally strong response by bulls. Neither camp is selling gradually; rather each group is producing moves that generate shock-and-awe.
The fact that the selloff’s gap is even larger and cleaner than the rally’s gap suggests an even stronger excitement than when prices were headed up. On the other hand, yesterday’s third candle didn’t dig deeply into the first day’s candle, mitigating its bearish implication.
Presumably, the price found support above the uptrend line since the March bottom, guarded by the 200 DMA.

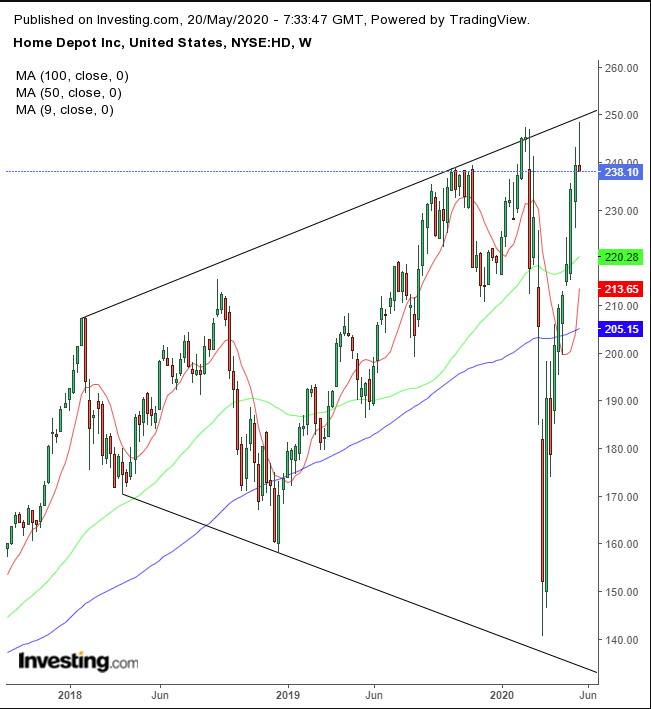
Having said that, what we find most powerful is the location of the pattern, at the very top of a massive broadening formation since January 2018, matching that of the S&P 500 last July.
Trading Strategies
Conservative traders are likely to wait for a descending series of peaks and troughs before considering a short position, or for higher highs amid an upside breakout of the long-term broadening pattern.
Moderate traders would probably short with a close below the uptrend line and 200 DMA.
Aggressive traders may short now, provided they understand the risk, write a trading plan accordingly and are prepared to lose the trade.
Trade Sample
- Entry: $240
- Stop-Loss: $250
- Risk: $10
- Target: $200
- Reward: $40
- Risk:Reward Ratio: 1:4
