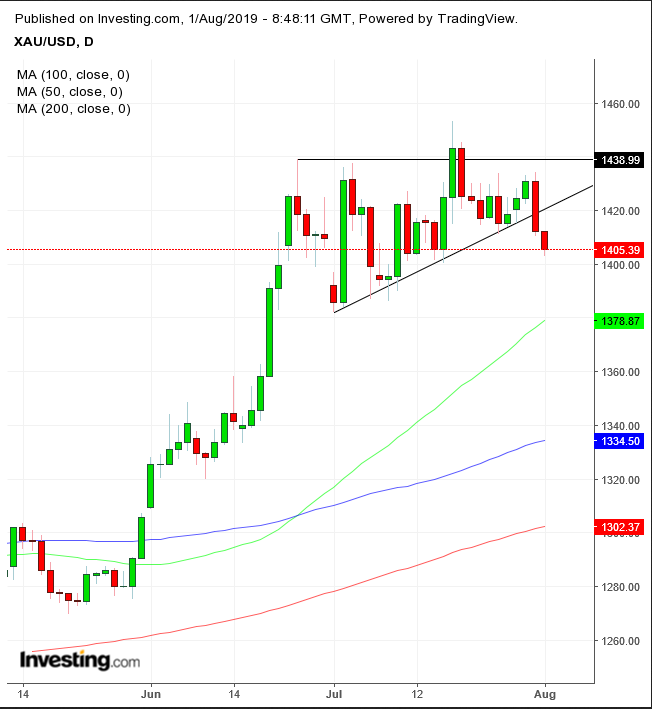
After strengthening in tandem with the U.S. dollar over the past few months, gold is now sinking — a sign it may be reverting to its customary inverse relationship with the greenback.
While the Fed yesterday announced the first interest rate cut since the bubble preceding the 2008 financial crisis, Chair Jerome Powell sent a hawkish message to dampen expectation of further easing. Stating “the labor market remains strong and economic activity has been rising at a moderate rate" the Fed was clearly signalling to the market it should not overprice additional cuts.
We expected the dollar to strengthen, even after a rate cut. But we also expected gold to rise as all-time highs established over-valuations amid multiple geopolitical risks and a global slowdown.
In addition, a negative yield environment would usually increase demand overseas for gold’s store of value. Finally, trading had developed a potentially bullish pattern.
This, however, has blown out. The yellow metal now appears set to return to its negative divergence to the yielding-dollar by which it is priced.

XAU Daily Chart
Gold has been trading within an ascending triangle, considered a bullish pause within the uptrend. The rising bottom against a flat top demonstrates buyers’ over-eagerness vs sellers, suggesting their commitment to the preceding uptrend. An upside breakout would have completed the pattern, after buyers absorbed all the supply available within the pattern and upped their bids to find a fresh batch of willing sellers.
Instead, however, the price fell below the lower boundary of the pattern, as the sudden outlook shift on rates reversed buyers into sellers, blowing out the pattern. Such a pattern failure tends to increase in momentum as buyers find themselves on the wrong side of the market and sellers curse themselves for not having been more proactive in what they already believed in. This presumed dynamic may turn into a free fall once speculators recognize a shorting opportunity, kicking the yellow metal when its down.
Both the lagging MACD and leading RSI have been triggering negative divergences, as they both flopped ahead of the pattern blowout.
Phillip Streible, senior market analyst at RJO Futures, says that gold has historically advanced in August in 13 of the last 15 years. The supply and demand dynamics suggest this August will go against those statistics, changing the read to 13 out of 16 years.
Trading Strategies
Conservative traders would stay out of this trade, as the trend is still up.
Moderate traders may short gold after it falls below the June 1, $1,381.91 low, followed by evidence of resistance.
Aggressive traders may short, after determining a balanced trade plan that fits their budget. Since we expect volatility, we picked a trade sample entry that would include a pullback, limiting exposure.
Trade Sample
