Shares of longtime market and investor favorite Apple (NASDAQ:AAPL) have recently been sold off amid the cyclical rotation out of tech stocks and into value shares. As a result, the iPhone maker's stock may be slipping into a bear market.
However, this isn't yet a foregone conclusion. There are a variety of parameters to keep an eye on in order to determine the stock’s viability, as well as the drivers that are flipping the supply-demand balance.

Note that the stock fell as much as 25% in September, when the tech sector suffered a selloff. Both the NASDAQ 100 and the Technology Select Sector SPDR® ETF (NYSE:XLK) dropped at the same time, each losing almost 15%.
However, while both those benchmarks were able to recover from those dips, Apple was only able to climb 5% above the September peak after which it immediately slipped and is now 13% below that level. Though Apple may have been pressured by the tech rout, it underperformed the sector during this period.
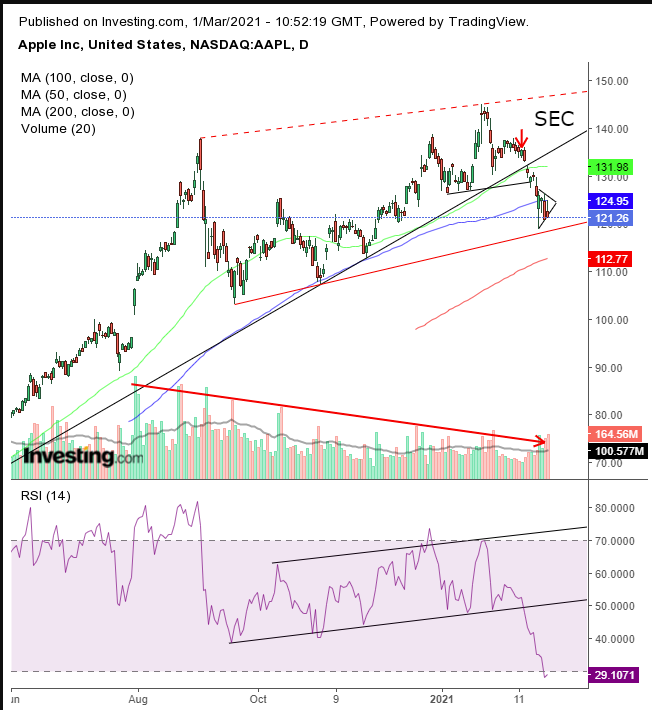
On Monday, Feb. 15, Apple stock dropped 1.6%, the start of the fall that created the left shoulder of Apple’s H&S top. In four sessions Apple dropped 4%, even as the NASDAQ 100, of which AAPL has an 11% weighting, dipped just 1%. During this same period news broke, via an SEC filing by Warren Buffett's Berkshire Hathaway (NYSE:BRKa), that the holding company had sold off $11B worth of its stake in Apple at the end of 2020, though it continues to retain $120B worth of Apple shares in its portfolio
It's convenient to speculate that the news was somehow a driver of this slump, but the actual trigger remains unclear. Whatever actually sparked the selloff, Apple completed a reversal in the form of a H&S top and is now forming a pennant, whose downside breakout will extend the drop. The importance of patterns is subject to their context. The H&S completed, as the price fell below the uptrend line since the March bottom, and the pennant is developing above an uptrend line since the September slip.
Note that volume provides a negative divergence to the rise since the September low, while a more focused volume study reveals that it has risen along the declines in the small H&S head and right shoulder, while drying up in the rallies that preceded it, demonstrating that participation is to the downside.
Even if the price rebounds after a completed small H&S top and a pennant, not yet complete, it could still develop a large H&S top, with the red trendline making the neckline.
The 50 DMA represents the H&S top, the 100 DMA the pennant and the 200 DMA the potential neckline of a massive H&S top since September, which—if this scenario plays out—is only a midway point.
The RSI provided a decided downside breakout, signaling the price may follow, plunging below its red line. To be sure, the RSI is the most oversold since May 2019, inviting a bounce. If that happens, it could serve the massive H&S theory.
Trading Strategies
Conservative traders should wait for the pennant to complete with a downside breakout that would include the red trendline and the 200 DMA below, then wait for a return move that demonstrates resistance.
Moderate traders would wait for the downside breakout of the pennant and the red trend line, then wait for a corrective rally for a better entry, if not for further confirmation.
Aggressive traders could short upon a downside breakout of the red trend line or a retest of the H&S neckline. A coherent trading plan is key.
Here is an example:
Trade Sample
- Entry: $128
- Stop-Loss: $130
- Risk: $2
- Target: $120
- Reward: $8
- Risk:Reward Ratio: 1:4
Author's Note: This is just a sample, one way to approach the trade, based upon the analysis within the post. The sample can fail even if the analysis is right, and it may be wrong. If you don’t understand and accept the risk, don’t trade. Incorporate your budget, timing and temperament into your trading plan. Practice with small trades, until you learn how to customize your plans.
