Facebook (NASDAQ:FB) can't seem to catch a break. Last week, the once vaunted social media giant experienced yet another blow to both its efficacy and reputation as a critical ad platform.
On the Tuesday before Thanksgiving, high season for holiday sale advertising and just ahead of both Black Friday and Cyber Monday—the most important shopping weekend of the year—Facebook's ad manager platform went down. According to CNBC, "buyers were unable to see data about how ads were performing, edit live ad campaigns, or start new ad campaigns." Some advertisers encountered problems for up to 8 hours.
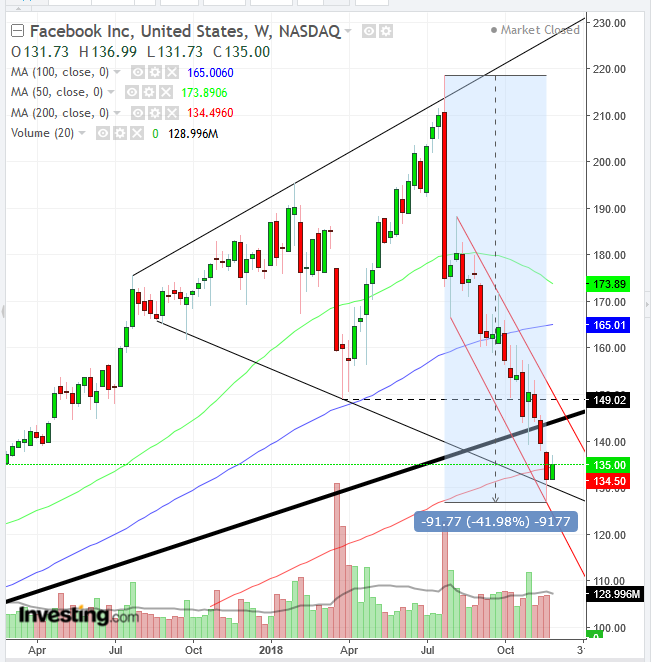
Facebook shares, which once seemed unstoppable, have fallen as much as 42% since the stock's $218.62 peak in July. Though currently trading at $135, having bounced off last week's $126.85 low, the stock hasn't recovered after a series of privacy abuse and user manipulation incidents went public, tarnishing Facebook's reputation.
We published a bearish call on the stock about a month ago. Shares have fallen more than $15, or 11 percent since. Unfortunately, we believe the stock will continue to decline.

The price has been developing a Broadening Pattern. This occurs when highs move higher while lows register lower. The pattern demonstrates that traders are not just confused but panicked.
This behavior reveals a market that lacks leadership. While buyers buy at ever lower prices, sellers sell at continuously higher prices. The underlying psychology for the bearish presumption is that the meandering pattern causes confused investors to lose interest as they grow tired of waiting for a sustained rally where both the peaks as well as the troughs would track higher.
An innate obstacle to successfully trading the broadening pattern is the challenge of determining a clear price level that establishes a breakout. In other words, the same problem that drives away demand, as described above, also makes the timing of an entry illusive. Which means there's both a bullish and bearish case to be made from the technical reading:
The Bullish Case:
- The price bounced off the bottom of the pattern, increasing upside risk.
- Diminishing volume increases the risk that selling is drying out, allowing for buyers to push prices up.
- The RSI fell to its most oversold condition since Facebook's 2012 IPO, potentially attracting contrarian traders.
The Bearish Case:
- The price fell below its longest uptrend line, since June 2013.
- The three major moving averages are in bearish formation, with shorter MAs below longer MAs, as the more recent the price data, the weaker it is.
- The price is imprisoned within a descending channel since August. In this pattern, both buyers and sellers agree that prices should fall—as each continually reduces its price, bid or ask—as opposed to the dichotomy of the 16-month long broadening pattern.
- The supply-demand balance is struggling against the 200-week MA. Should it close for the first time below the most influential MA, even more so if followed by a decline, it would bolster the case for a continued downtrend, both in the long-term as well as the medium-term.
Bottom Line: We find the weight of the evidence to support the bearish case, while upside risk remains. Therefore, though money management is critical in general, it is even more crucial for this trade.
Conservative traders should wait for a clean downside breakout, below the ever-receding support line at the bottom of the pattern, followed by a return move that confirms the reversal, as prices fall back after hitting the underside of the pattern.
Moderate traders may consider the possibility of the price falling below its most extended uptrend, a downside breakout. They should wait for the same confirmation as conservative traders do.
Trade Sample: Short Position
- Entry: $140, after falling from the pattern bottom around $144.
- Stop-loss: $144
- Risk: $4
- Target: $128
- Reward: $12
- Risk-Reward Ratio: 1:3
Aggressive traders may enter a long contrarian position and join their moderate friends after a return move.
Trade Sample: Long Position
- Entry: $130
- Stop-loss: $129, below round psychological number
- Risk: $1
- Target: $140, round psychological number below the broken uptrend line
- Reward: $10
- Risk-Reward Ratio: 1:10
