Netflix (NASDAQ:NFLX) shares' recent wild swings may be like the flickering of a candle before it goes out.
The stock price plunged more than 4% yesterday, after having plummeted almost 6.2% on Oct. 18. The streaming giant has been plagued by the outlook for increasing competition in the streaming industry, from the likes of Disney (NYSE:DIS) and Apple (NASDAQ:AAPL).
Yesterday's drop came hot on the heels of the news that Verizon (NYSE:VZ) has partnered with Disney to offer a package that includes Disney Plus free for a year to unlimited wireless customers — of which the communication giant has 50 million — and an increasing number of eligible clients on unlimited plans, as well as its new Fios broadband and 5G home wireless internet customers.
Bulls argue that Netflix has been successfully contending with competition. The company has a dramatic head start in streaming content and even if and when Disney catches up, there is enough business to go around between the two.
Bears, on the other hand, consider Netflix a bad investment decision, as the technicals suggest Wall Street may have fallen asleep at the wheel just as the road grows increasingly crowded with competition.
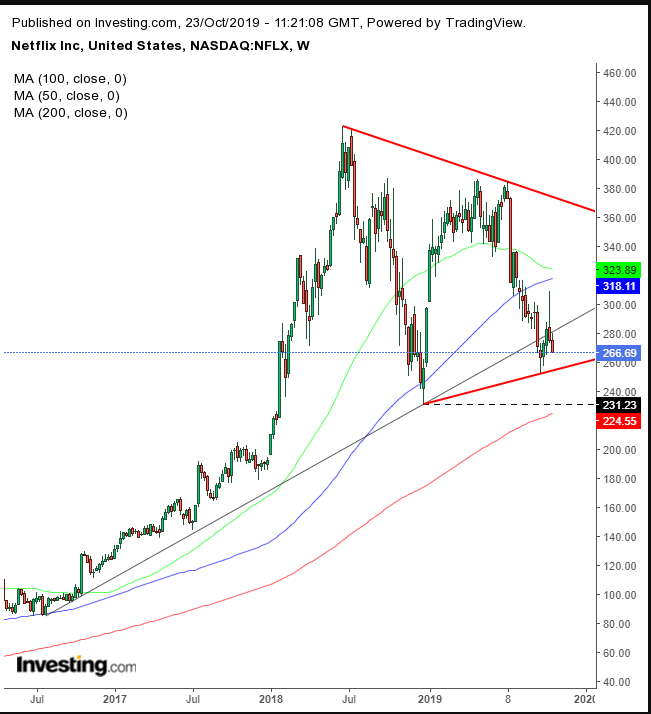
These two perspectives are reflected in the chart.

Netflix has been consolidating in the long term, since June 2018, posting lower highs, while concurrently registering higher lows — converging within a symmetrical triangle. This pattern, by definition, means that both supply and demand are rising, as investors continuously increase their bets. But who will win? Which side of the supply-demand balance will overwhelm the other side and see prices pushed into its own preferred direction?
The stock price closed September below its uptrend line since July 2016. In the first week of October, the stock closed back into the pattern. In the second week it penetrated a third deep into it, but found resistance by the 50- and 100-WMAs, closing back below it. The stock is now falling below the uptrend line for the second week. That could prove to be a prelude to the establishment of a downtrend, when a new low would form a new descending series of peaks and troughs.
In the previous selloff — the second downswing within the triangle, when the price fell for two weeks below the uptrend line — the price came to within 10% of the 200 DMA for the first time since it overcame the major MA in January 2013. Lo and behold, it aligned with the December bottom, the first low within the triangle, and the first potential low of a downtrend. That makes this price level a technical pressure point, where the market mechanics and environment could flip.
Trading Strategies
Conservative traders would wait for two independent peaks and troughs, excluding the last peak and trough in the previous uptrend.
Moderate traders may be content with a trough lower than the December bottom, for two falling peaks and troughs, including the previous peak and trough, which belonged to the uptrend.
Aggressive traders would short upon a return to the broken downtrend line or a close below the symmetrical triangle.
Trade Sample – Short Position Setup
Note: A trade sample is just a sample. It does not presume that it’s a winning trade. Trading success requires multiple trades that attempt to turn a profit as a few winning trades cover the losing trades.
