Yesterday, the price of oil surged almost 5%. It was the biggest move for the commodity since June, which has recently mostly been trading within a range.
WTI broke through the key, psychological $40 level, aided by two tailwinds: Hurricane Sally making landfall along the US Gulf Coast, home to a broad swath of oil and gas refineries as well as bases for offshore rigs, along with the latest EIA inventory release which showed a drawdown in oil stocks for the week.
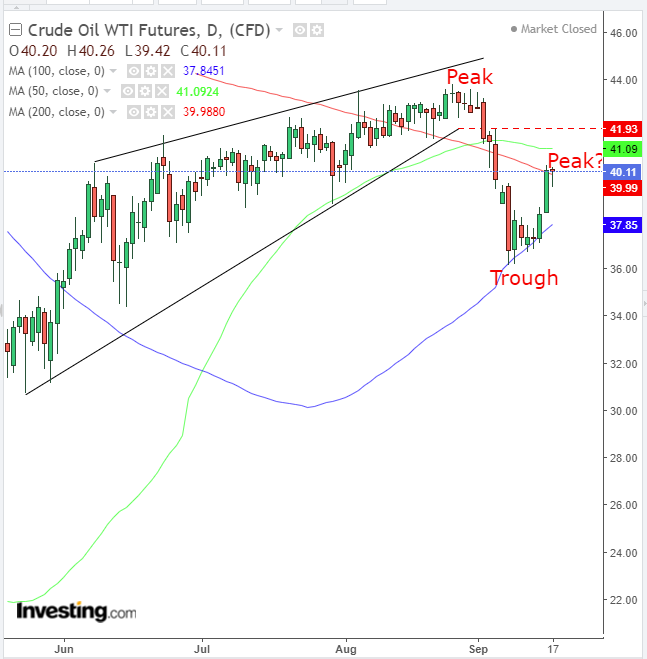
In total, WTI climbed 7.6% over two sessions on Tuesday and Wednesday, the sharpest two-day rally since May 28-29. Another interesting development occurred during those two days as well: the start of a rising wedge, famously a bullish pattern. But this one was bearish.

Chart powered by TradingView
When a rising wedge follows a decline, it’s expected to break to the downside, after bulls gave it all they'd got and failed to start an uptrend. Our rising wedge, however, follows an advance.
The problem: the climb was too steep. It went from -$40 to +$40 in a month and a half, a stupendous 207.5% jump.
After many eulogized the oil market because of its descent into sub-zero territory, opinions reversed as the price rose, with others speaking of a return to $100 and beyond. Eager traders—witnessing a once-in-a-lifetime market event and treating it as though it were the opportunity of a lifetime—threw their money at oil.
However, there was considerable profit-taking, adding pressure to the supply side. At the same time, coronavirus lockdowns kept planes grounded and cars parked, hitting oil demand the most in history.
The price created a rising wedge because buyer eagerness outweighed that of sellers. However, after more than 60 trading sessions in almost three months failed to drive any meaningful moves, traders simply gave up. As demand vanished, and all that remained was selling pressure, prices plunged, breaking the bottom of the rising wedge.
After touching the lowest levels of late-May, the price appeared to reach an equilibrium in the supply-demand balance, remaining in a holding pattern for four days, until Hurricane Sally and this week's unexpected crude draw sent prices jumping.
Given that the price achieved half of the rising wedge’s implied target, we consider this a return move, providing a second chance to short oil. The major MA interplay, underscoring the supply-demand pressure points on the chart, supports this view.
The 50 DMA gravitated to the wedge, with the 100 DMA providing the support for the initial pattern penetration, while the 200 DMA—halving crossed below the 500 DMA, triggering the dreaded Death Cross—provided resistance to the return move. Today’s trading is forming a hanging man, bearish upon confirmation of a follow-up candle that closes below the hanging man’s real body, the price between the open and close, disregarding intraday moves.
Trading Strategies
Conservative traders would wait on a short until the price falls below $36.13, the Sept. 8 low, establishing a lower trough, and with it the descending series of highs and lows needed to call a downtrend.
Moderate traders would short if today’s closing price forms a hanging man and is confirmed tomorrow with a close below its real body.
Aggressive traders may short at will, provided they've worked out the trade’s risk and accepted it. Following is an example of a trade plan.
Trade Sample
- Entry: $40
- Stop-Loss: $42 – tip of the wedge
- Risk: $2
- Target: $32 – above the wedge’s bottom, its minimum objective
- Reward: $8
- Risk:Reward Ratio: 1:4
Author's Note: This is only a trade sample. It is not the answer to all trading, just one possibility. It's provides as an aid to understanding the core elements of a trade. If you read the sample and compare it to the full article you may understand why we picked these parameters. It wasn't arbitrary. That, however, doesn’t mean that the sum total of supply and demand will necessarily trade accordingly.
