Apple's (NASDAQ:AAPL) quarterly results after the bell Tuesday will be watched closely for clues over the fate of FAANG stocks. Some heavily underwhelming earnings reports have turned the stocks from high-flying market darlings into a favorite for shorts.
Investors are currently slashing their exposure to tech mega-caps on fears that they are dangerously overvalued. Will Apple’s report reverse the pessimism and help the tech sector bounce back?

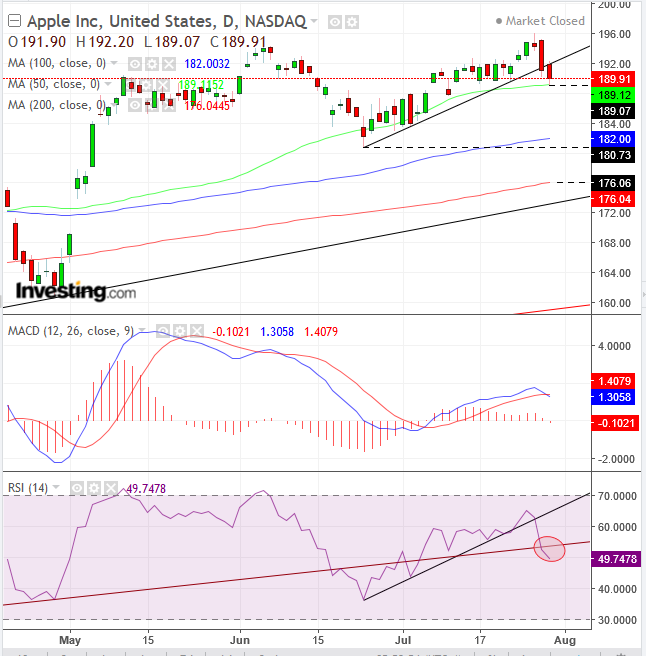
Apple's stock slipped for a third-straight day, crossing below its uptrend line since the June 25 low. Should the price fall below the June 25 low of $180.73, it will have completed a double-top reversal.
The MACD provided a sell signal, as the shorter MA crossed below the longer MA, demonstrating relative price weakness. Moreover, the RSI has shown that momentum around support was sliding alongside prices. The indicator has also dropped below its uptrend line since the February low, suggesting that prices may follow, sliding below their uptrend line since February 9, currently at the $176 level.
But while aggressive traders may short shares of the tech giant on expectations for a short-term decline, they should bear in mind that they remain within a midterm and long-term uptrend.
The major moving averages are underpinning technical pressure points (marked by dotted lines), where supply might be met with demand. The 50 DMA (green) provided support to yesterday's price, which closed higher, after touching it. The 100 DMA (blue) is aligned with the June 25 low, from which the short-term uptrend line was drawn. Finally, the 200 DMA (red) is "holding the line" with the uptrend line since February.
Trading Strategies - Short Position Setup
Conservative traders would wait for a clearer picture on the trend, with either a higher peak above $196 or with two descending peaks and troughs, below the long-term uptrend line since mid-2016, currently, at $160.
Moderate traders are likely to wait for a downside breakout of the double-top, followed by a decline below the midterm uptrend line since February.
Aggressive traders may short now, relying on sentiment, violation of the short-term uptrend line since June 25 and the MACD and RSI sell signals. But they should make sure the move is compatible with their overall equity management and ensure a 1:3 risk-reward ratio.
Equity Management
Negative Trade Example
- Entry: $190, psychological round number resistance
- Stop-loss: $196, above Thursday’s intraday high.
- Risk: $6
- Target: $181, above the preceding trough, posted June 25.
- Reward: $9
- Risk-Reward Ratio: 1:1.5
Too risky relative to the potential compensations. Reduce exposure or increase target, or do NOT trade.
Positive Trade Example
- Entry: $192, broken uptrend line resistance
- Stop-loss: $196, above Thursday’s intraday high.
- Risk: $4
- Target: $180, round psychological number, which might provide support, even upon double-bottom intraday penetration.
- Reward: $12
- Risk-Reward Ratio: 1:3
Acceptable risk relative to reward.
