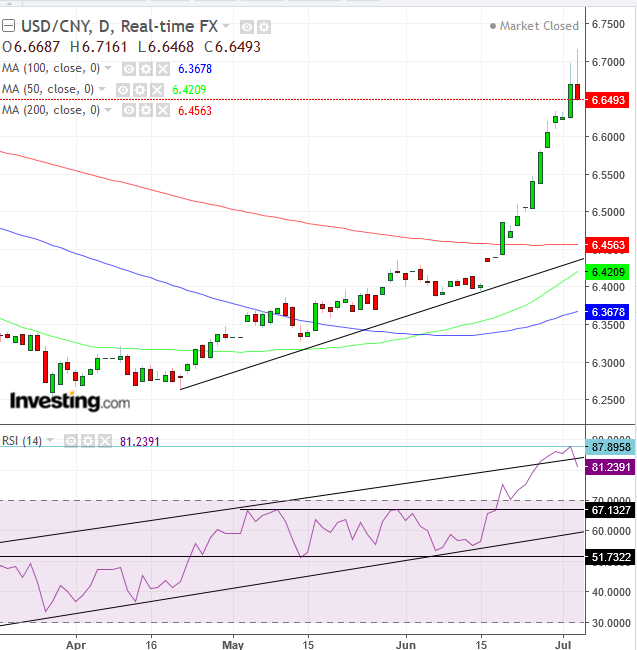
China's yuan has been spiraling lower, falling earlier today for the tenth time in twelve days, for a loss of 5 percent, its worst selloff since 2015. It's now at its weakest point in almost a year, at its lowest level versus the USD since August 2017. As well, according to the Wall St. Journal, "the yuan ended June with one of its biggest monthly losses on record, tumbling 3.4% against the dollar."
To stop the slide, and hopefully prop up the slipping currency, this morning the People's Bank of China (PBoC)—via two different officials—signaled the possibility of intervention. As the Friday deadline imposed by US President Donald Trump for levying tariffs on an additional $34 billion of Chinese imports nears, the yuan fell south of 6.7 per dollar spurring China's deputy governor of the PBoC and head of forex regulation, Pan Gongsheng, to express confidence the country would ensure a "reasonable" level for the currency according to Reuters.The central bank's Governor Yi Gang concurred, saying China will "keep the yuan exchange rate basically stable at [a] reasonable and balanced level."
The biggest driver of the current renminbi slide is the US-China trade dispute. Even before the trade conflict began, Chinese equity markets were already suffering because of escalating capital outflow due to a government crackdown on risky, highly leveraged investments. A third, unexpected driver has been the strengthening dollar, drawing investment out of emerging markets. All told, Chinese markets have now lost $2 trillion of value. An added 'bonus': the yuan has now become the world's worst performing currency, a dubious honor.
To appreciate just how significant this FX 'honor' is, during this same period, other emerging market currencies such as the Turkish lira and Indian rupee have each hit their own record lows.
After the dual PBoC statements the yuan stabilized and inched higher. At this juncture, bears have taken control of the USD/CNY pair, with momentum now on the side of the yuan.

The yuan’s rebound formed a shooting star for the currency pair, a visual representation of sellers pushing back buyers' advances, a bearish signal. This is happening at the same time the Relative Strength Index topped out of its most oversold level since January 2016.
The RSI has fallen back into a momentum rising channel since February, increasing the probability of it continuing to fall back toward the channel bottom, which would likely be around 67, formerly a May-June resistance, now presumed support, as market dynamics flipped.
The 50 DMA (green) is heading toward the uptrend line since April 20 and the 200 DMA (red), after crossing the 100 DMA (blue) mid-May. This convergence may trigger a technical catalyst, one way or another.
Trading Strategies
Conservative traders trade only with the trend and will, therefore, wait for the correction to end, in order to go long, perhaps around the 6.5 level.
Moderate traders may enter a risky trade if the capital they might sacrifice is minimal, providing a very favorable risk-reward ratio and offsetting the position's risk. If the price retests the 6.700 level, they might consider shorting, placing a stop-loss above the 6.7161 daily high.
Aggressive traders would short at a price that enables them to place a stop-loss above the daily high or as high as they are willing to risk while accepting that they might be stopped out.
Equity Management
Whatever your risk aversion, establish a trading plan before entering a position, with a minimum 1:3 risk-reward ratio.
Trade Example 1: Negative Example
- Entry: 6.6500 Round-psychological number and expected uptrend line
- Stop-loss: 6.7170 Risk: 670 pips
- Target: 6.5000 Reward: 1,500 Risk-Reward Ratio: 1:2
Trade Worthiness: This is a poor bet, as the trader is not maximizing statistical returns and is likely to fail in the long run, even if this trade does win.
Trade Example 2: Positive Example – Waiting for Full Correction
- Entry: 6.7000 Today’s opening price
- Stop-loss: 6.7170 Risk: 170 pips
- Target: 6.6000 Reward: 1,000 pips Risk-Reward Ratio: 1:6
Trade Worthiness: Excellent, twice the minimum required ratio.
Trade Example 3: Positive Example – Riding Full Correction
- Entry: 6.6500
- Stop-loss: 6.6700 (Opening Price)Risk: 200 pips
- Target: 6.6500 Reward: 1,500 pips Risk-Reward Ratio: 1:7.5
Trade Worthiness: Excellent
