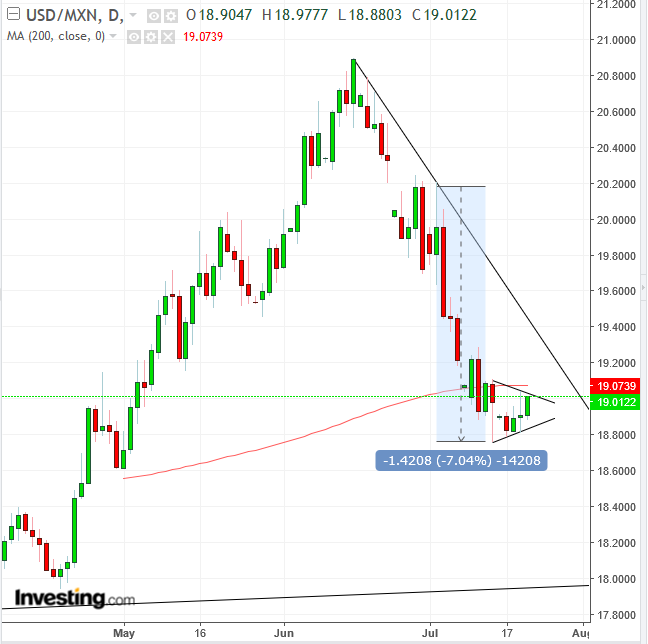
While the world’s attention has been focused on the US dollar, there is another currency that has been strengthening against the greenback and was even able to hold its own as the dollar went on a tear: the Mexican peso.
Since June, the peso has been strengthening versus the dollar by as much as 10 percent. It was flat against the dollar since July 11 when the greenback was moving.
The recent climb by the peso follows a fall of as much as 44 percent since Donald Trump announced his presidential run in June 2015. Trump's threats to leave the NAFTA trade agreement to pursue separate, bi-lateral trade deals sparked uncertainty and weighed heavily on the currency.
Trump, however, said yesterday that the US and Mexico are "getting closer" to reaching a trade deal. Why has the Mexican peso been strengthening for a month then? Maybe some people were aware that negotiations between the two countries were in the final stages. This would help explain why the USD/MXN has been trading lower since its June 15 high, though it is easing today after yesterday's slide.

The currency pair has been developing a pennant pattern—a continuation pattern, complete with a downside breakout, since June 11. The pattern is shaped symmetrically, showing that both buyers and sellers are committed.
Note that the bull-bear struggle is taking place beneath the 200 DMA, right after the price crossed below it, underlining how important this level is as a support and resistance, a “red line” for both buyers and sellers.
Trading Strategies – Short Position Setup
Conservative traders would wait for a downside breakout with at least a three-percent penetration and three sessions in which the price remains below the pattern, followed by a return-move that would verify the pennant's integrity, with at least one long, red candle following a green candle.
Moderate traders might wait for just a two-percent filter, with a return-move for a better entry, but not necessarily for proof of the pattern’s resistance.
Aggressive traders might risk a short immediately, relying on the trend, the 200 DMA violation and the resistance of the top of the pennant, where it is currently trading.
Equity Management
The following trade sample could be the same for all the risk levels. The difference is not in price but in movement confirmation, as illustrated above.
- Entry: 18.8000
- Stop-loss: 18.8500 Risk: 500 pips
- Target: 18.0000 Reward: 8000 pips Risk-Reward Ratio: 1:16
