Chart Of The Day: NASDAQ On Watch As Yields Resume Higher

Published 2021-03-12, 09:45 a/m
XAU/USD
-
DJI
-
US2000
-
DX
-
GC
-
IXIC
-
US10YT=X
-

This article was written exclusively for Investing.com

Following Thursday’s rally when the Dow and Russell 2000 set new record highs, index futures dropped sharply lower ahead of the US open on Friday, along with gold. The dollar was higher across the board.

The culprit? Rising yields.

The 10-year bond yield returned to 1.6% after President Biden signed off on the latest $1.9 trillion stimulus plan, which has boosted the prospects of stronger recovery and inflation. Such a scenario would require tighter monetary policy from the Fed, which is seen as particularly bad for high-flying technology stocks. Investors worry that yields will rise further, making growth companies’ future cash flows less worthy. 

So, keep a close eye on the NASDAQ, after the tech-heavy index ran into strong resistance again following a few days of solid gains. The sellers have stepped back in after the index rallied into resistance around the shaded region shown on the chart. This is where the point of origin of the initial breakdown converges with the now falling 21-day exponential moving average:
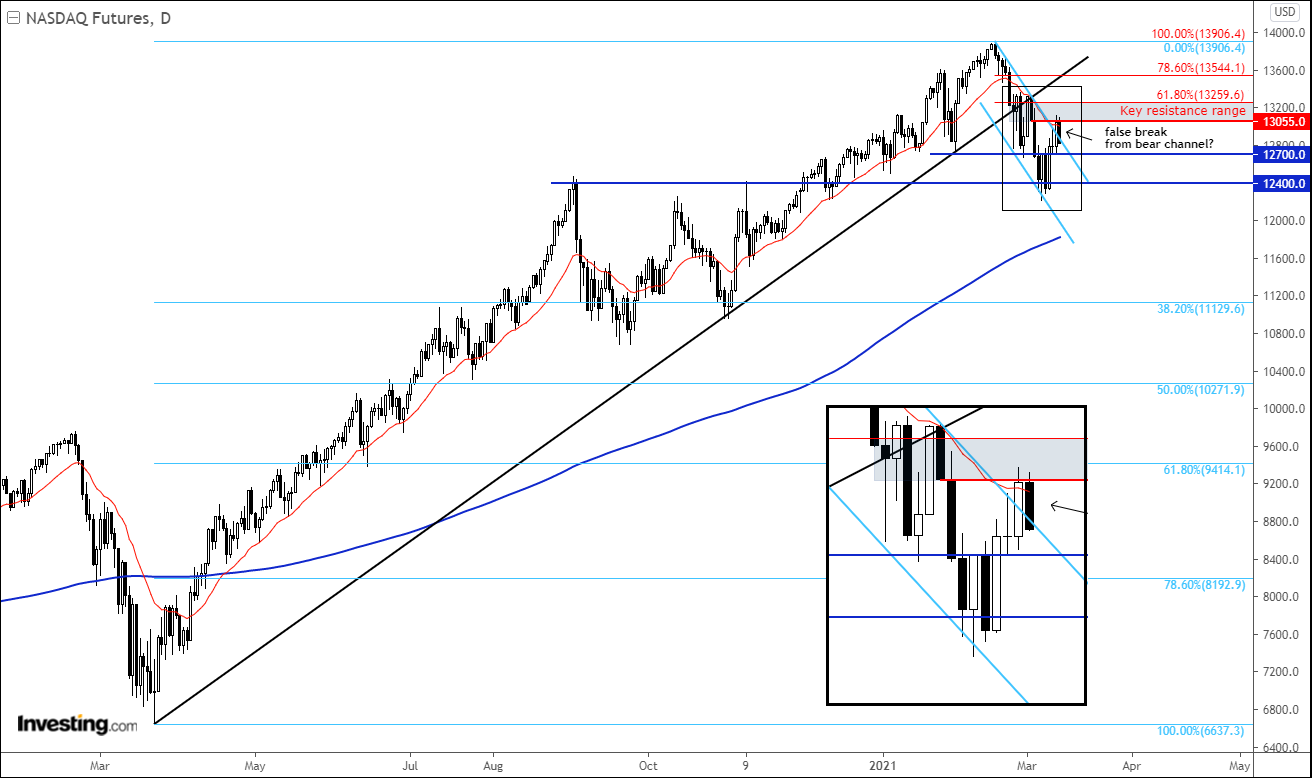
NASDAQ Daily

The chart looks worrying for the bulls, because it shows Thursday’s breakout attempt from a bear channel has failed. Such failures are typical of a changing trend. In this case, the long-term bull trend appears to have turned after the index broke below its 1-year-old bullish trend line a couple of weeks ago.

If the index ends back inside the bear channel on Friday, then I would expect to see further losses in the early parts of the week ahead. 

Short-term support is seen around 12700. There is going to be lots of sell stops resting below this level from traders who bought the latest rebound. If the index breaks this level, expect to see a sharp follow-through on the downside.

It is imperative, therefore, that the bulls manage to defend this level today. Failure to do so could see the index drop all the way to 12400 in the coming days, and possibly further lower over time

Latest comments

Loading next article…
Risk Disclosure: Trading in financial instruments and/or cryptocurrencies involves high risks including the risk of losing some, or all, of your investment amount, and may not be suitable for all investors. Prices of cryptocurrencies are extremely volatile and may be affected by external factors such as financial, regulatory or political events. Trading on margin increases the financial risks.
Before deciding to trade in financial instrument or cryptocurrencies you should be fully informed of the risks and costs associated with trading the financial markets, carefully consider your investment objectives, level of experience, and risk appetite, and seek professional advice where needed.
Fusion Media would like to remind you that the data contained in this website is not necessarily real-time nor accurate. The data and prices on the website are not necessarily provided by any market or exchange, but may be provided by market makers, and so prices may not be accurate and may differ from the actual price at any given market, meaning prices are indicative and not appropriate for trading purposes. Fusion Media and any provider of the data contained in this website will not accept liability for any loss or damage as a result of your trading, or your reliance on the information contained within this website.
It is prohibited to use, store, reproduce, display, modify, transmit or distribute the data contained in this website without the explicit prior written permission of Fusion Media and/or the data provider. All intellectual property rights are reserved by the providers and/or the exchange providing the data contained in this website.
Fusion Media may be compensated by the advertisers that appear on the website, based on your interaction with the advertisements or advertisers.
© 2007-2025 - Fusion Media Limited. All Rights Reserved.