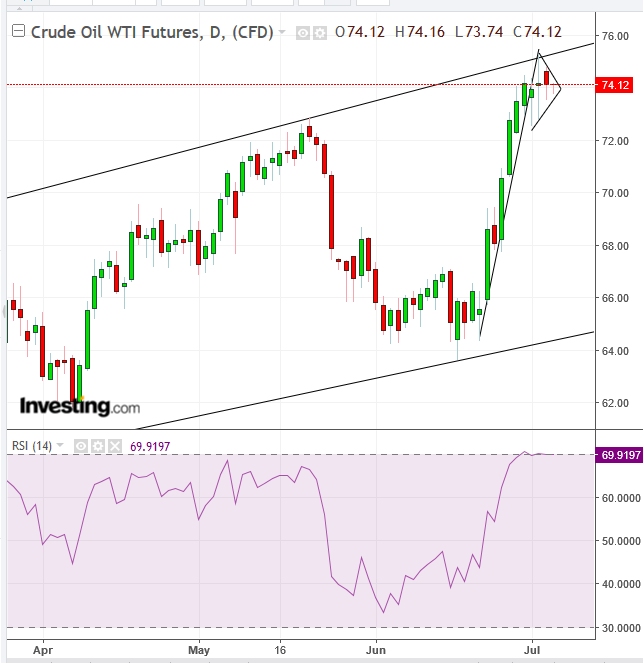
The current oil slump represents a buying opportunity, from both a fundamental and technical standpoint. While US President Donald Trump’s hawkish rhetoric may have short-term effects on the oil market, the broader supply-demand fundamentals continue to prevail. Technically, the selloff fits a trading pattern That could prove exceptionally bullish.
Fears of shrinking global supply were offset by signals from Saudi Arabia of a boost in production, sending the price of WTI lower for a second day on Thursday.
The selloff comes after crude oil hit a nearly three year high on Wednesday, of $75, after it jumped by 17% over the course of nine trading sessions. It was spurred by Trump tweeting:
The OPEC Monopoly must remember that gas prices are up & they are doing little to help. If anything, they are driving prices higher as the United States defends many of their members for very little $s. This must be a two-way street. REDUCE PRICING NOW!
With a tough mid-term election looming in November, it's essential to Republicans that crude remains below $75 a barrel.
But do OPEC producers really have the power to reduce prices at this point? Bart Melek, head of global commodity strategy at Toronto's TD Securities, thinks not. "Even if Saudi Arabia does provide much of the oil to replace any shortcomings from Iran or Libya or Venezuela, that has the market concerned that we will be hitting fairly low levels of spare capacity," he told Bloomberg.
Tamas Varga, an analyst at London's PVM Oil Associates Ltd, said:
"Bulls are regaining control. It looks as though any additional supply increase from Gulf producers and Russia will not be able to replace lost barrels from Libya, Iran, and Venezuela."
The American Petroleum Institute (API) reported on Tuesday that US oil stocks dropped by 4.5 million barrels in the week ending June 29—the key driver of WTI's near-three-year spike on that same day, before Trump's latest tweet pushed prices lower again.
And the Energy Information Administration (EIA) is expected to report that US inventories fell by another 5.2 million barrels during the same week, which would officially ratify a seventh straight weekly decline.
There are two concurrent dynamics driving oil prices higher at present: multiple production glitches are squeezing global supply, just as international demand is rising. Indeed, Morgan Stanley stepped up its outlook for Brent crude prices to $85 a barrel next year, even after the dampening effect of Trump's tweets.
Can the "Trump Effect" overcome the double-whammy of falling global supply and rising demand? We don't believe it can, nor do the commodity's technicals.

The price of WTI is developing a pennant, after penetrating Tuesday's rising channel’s top when it touched the key $75 psychological level. On the other hand, the RSI is the most overbought since January. An upside breakout will not only complete the pennant, which is bullish in an uptrend, but also breach the channel top, turning resistance into a support, as the market dynamic flips.
Trading Strategies: Long Position Setup
Conservative traders would wait for a trifecta of at least a 3 percent penetration of the pennant/channel top/$75.00 level, above the $78 level, then wait for a return move to confirm they're on solid footing, with at least one long green candle, engulfing at least the preceding red candle, or small candle of any color.
Moderate traders may feel satisfied with an upside breakout of the pennant of 2 percent, past the $75.65 level, preferably on a closing basis. They might wait for a return move, if not for confirmation of the pattern’s integrity, to at least secure a better entry.
Aggressive traders should go long with a close above $75.
