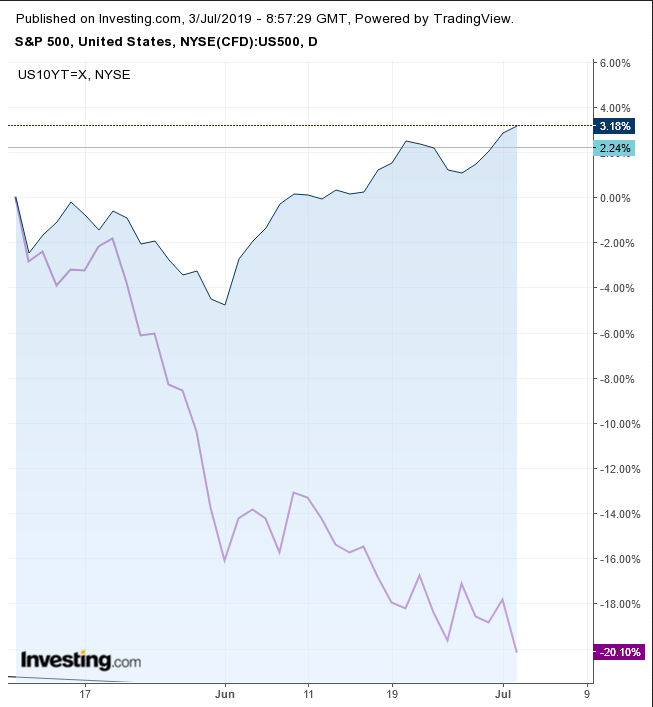
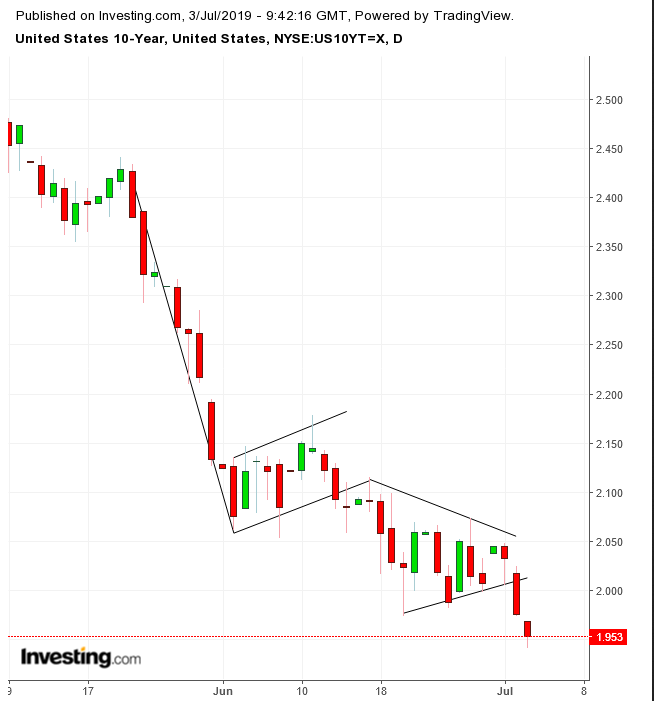
Yields on the 10-year Treasury fell back beneath the key 2% level today as investors sought shelter on growing concerns over a pending recession. Why, then, did the S&P 500 Index just hit back-to-back record highs?
Will equity traders continue to risk buying the most expensive stocks in history, even as plunging yields signal dire warnings of economic slowdown?

Stocks are shares, representing units of companies. Therefore, the value of stocks rises when companies profit; they fall when earnings shrink. Company fortunes tend to be tied in with that of the economy. So why is demand increasing both for bonds—on expectations of economic contraction, and for stocks—on forecasts of profit growth?
Since the 2008 crash, followed by the Great Recession, investors have come to rely on central banks to increase liquidity, which in turn cheapens money. Since assets are denominated by the same money, they become easier to acquire, making them worth less. Therefore, whenever investors felt that policy makers were rolling back unprecedented accommodation, they sold off in panic. Every indication of further stimulus, on the other hand, brought about exuberant demand, regardless of actual economic performance at the time.
Topsy-Turvy Market
The stock market has always been considered a leading indicator to the economy—on the premise that some of the smartest people on the planet, with the money of the richest people on the planet, had the best idea of where the economy was heading, and were capitalizing on that knowledge. But in the current topsy-turvy financial market, the economy has instead turned into a leading indicator for the stock market.
Investors have turned investing on its head, buying stocks when the economy weakened — counting on further stimulus — and selling off when it strengthened, as if exhibiting withdrawal symptoms from central bank drugs.
Right now, both stocks and bonds are rising on the same expectation, lower rates amid a contracting economy. Stock investors are eying each other suspiciously, expecting everyone else to buy up even from record levels, whenever the Fed is slated to ease policy. They don’t want to lose out to their competitors.
Sell-Off Point
However, the greater the equity-yield divergence—amid an inverted yield curve, increasing the probability of a recession ahead—the more equity bulls will second-guess themselves, right up to the breaking point. At that juncture, the same investors, still eying each other, will then race to sell off stocks that have been long overpriced.

Meanwhile, yields have extended a downside breakout of a pennant continuation pattern, following a rising flag, bearish in the downtrend – back to back bearish patterns – strongly suggesting yields will be continuing lower.
And so, now that yields have wiped out all gains since Donald Trump won the U.S. presidency in 2016, can we expect equities to follow suit?
That would imply a 28% correction. However, if that were to happen, it would mean the S&P 500 index had likely reversed into a long-term downtrend. This would create the potential for an even fuller correction than the 2002, 2008 lows. In this scenario, the SPX would shed upward of 70% of its value.
