Air Canada moves to lock out flight attendants after talks collapse
Despite signs of robust US economic strength after Friday's nonfarm payrolls release beat expectations and the wage component of the report showed gains above 3 percent for the first time since 2009, equity investors appear to have grown skittish.
Yet more puzzling, with 75 percent of earnings reports already announced, and despite monster, multi-year high earnings growth, stocks keep being sold off. Judging by the pummeling Apple (NASDAQ:AAPL) shares received on Friday, despite beating on EPS and revenue estimates, the stock was dumped because of investor disappointment about weak forward guidance and a change in how the company will report its revenue breakdown.
The lower guidance is a result of the ongoing US-Sino trade war. The market narrative says a sustained trade war would shrink or even end growth.
There's been no evidence of this so far. Nevertheless, the S&P 500 has been struggling. If investors are blowing things out of proportion, operating on sentiment rather than economic and market fundamentals, perhaps, so are the company executives currently providing softer guidance.
Still, from a technical perspective, supply has been overcoming demand and may continue to do so in the mid-term.

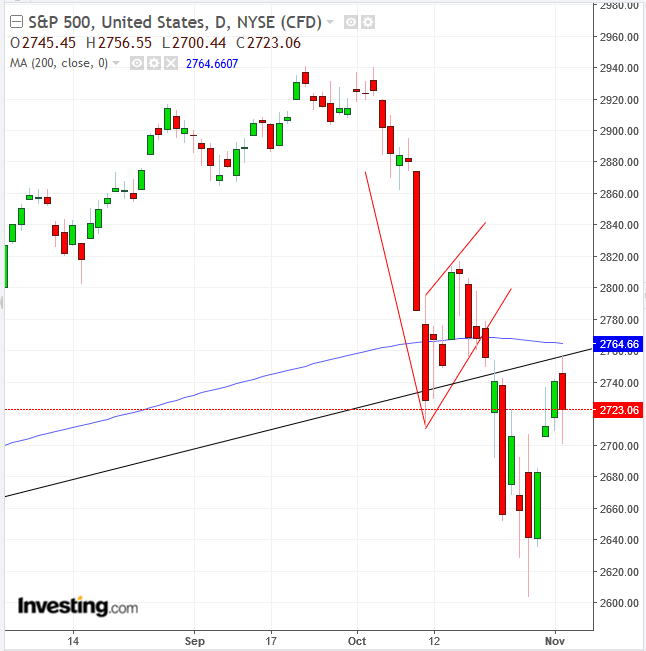
Last week, the S&P 500 ended a three-day rally to finish out the week with a decline. Friday’s selloff may have signaled the end of a return move after the completion of a bearish, rising flag (red lines). The presumed mechanics of such a move is that of a short squeeze followed by profit taking. The resistance beneath the completed flag suggests the previous drop would repeat itself.
The resistance also just so happened to be below the broken uptrend line since the February 2016 correction. Finally, the 200 DMA also happened to appear at the same price level. This triple resistance does more than add layers of selling pressure. It also confirms the importance of this level as a pivotal point in the supply-demand balance.
While traders measure the previous move, or the flagpole, our objective is conservative. Thus it only includes the two-day fall before the flag body. The previous two days were a consolidation, in which sellers may have already cashed out from the prior three-day slide, making them not necessarily part of this ride.
Trading Strategies – Short Position Setup
Conservative traders should not trade against the long-term trend, which is still up, since 2009.
Moderate traders may short, as the midterm trend is down. They may reduce risk by waiting for a bounce, which would bring price closer to resistance, above which they'd place their stop-loss.
Trade Sample:
- Entry: 2,750
- Stop-loss: 2,765, above the 200 DMA
- Risk: 15 points
- Target: 2,650, above last Monday’s low.
- Reward: 100 points
- Risk-Reward Ratio: 1:7
Aggressive traders may short immediately, rather than wait for a rally, in case there isn't one.
Trade Sample:
- Entry: 2,725
- Stop-loss:2,740
- Risk: 15 points
- Target: 2,625, above last Monday’s low
- Reward: 100 points
- Risk-Reward Ratio: 1:7
Which stock to consider in your next trade?
AI computing powers are changing the Canadian stock market. Investing.com’s ProPicks AI are winning stock portfolios chosen by our advanced AI for Canada, the US, and other exciting markets around the globe. Our top strategy, Tech Titans, nearly doubled the S&P 500 in 2024 - one of the most bullish years in history. And Beat the TSX, designed for broad market exposure, is showing +878% gains with 10 years’ back-tested performance. Which Canadian stock will be the next to soar?
Unlock ProPicks AI