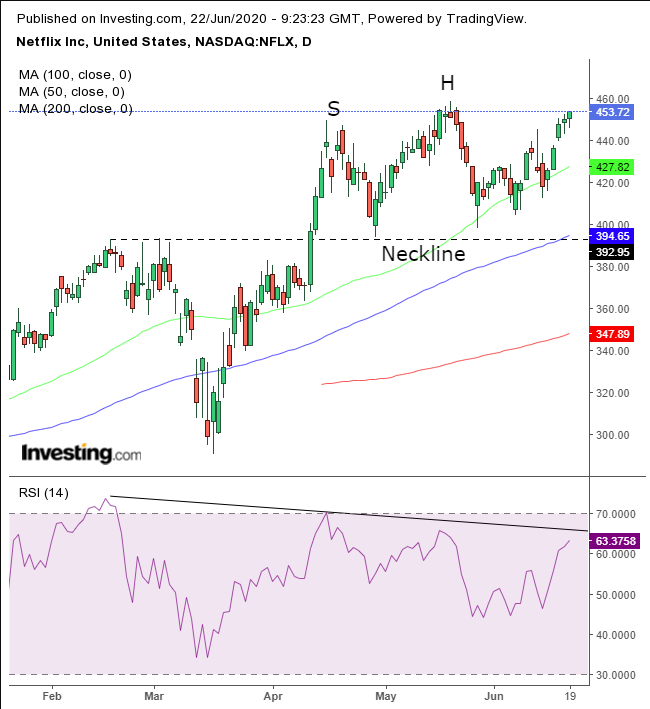
The persistent rise in coronavirus cases has punctured the hopes for a V-shaped economic recovery. But not all stocks have suffered. While the NASDAQ wallowed for the past three sessions on negative news about COVID-19, Netflix (NASDAQ:NFLX) added 4.1% in value, rising for five straight days to within just 0.1% of its May 15 record.
The streaming entertainment provider not only gained while the broader market was rising earlier this year, but it also rallied when the main indices fell at the start of this month on the back of fears of a second wave of coronavirus. This may signal Netflix’s stock is due a second wave higher of its own.
The NASDAQ climbed 29% between March 17 to April 16, while Netflix surged by more than 50%. A prolonged, or recurring, lockdown would benefit subscription retention and growth for the company, perhaps even more so than the first wave of COVID-19. A return to lockdown might have an even greater psychological impact on consumers, who might seek escapism.

Netflix is setting up a H&S top. The RSI still supports that scenario, demonstrating weakening momentum. To be clear, the stock may still top out if the broader market sees a selloff, before resuming its upward trend.
However, if the stock clears the $460 level, it will blow out the pattern, creating bullish momentum. All traders caught in the crossfire would need to dive out of the way quickly, if not roll with the punches, as Netflix heads higher.
Conversely, a fall below $400 would increase downside risk toward $300. Friday’s trading pattern developed a potential Hanging Man, when bulls managed to repel a bearish attempt to push prices drastically lower.
While intuitively a bullish pattern, a close below Friday’s real body—the price range between the open and the close—would be bearish. This would suggest the buying on Friday may have been nothing more than a short squeeze. If prices do buckle, the next test would be $400, where bulls would have the opportunity to regroup and glide on a second wave.
Trading Strategies
Conservative traders would wait for the price to close above $473, employing a minimum 3% filter, to reduce the likelihood of a bull trap. Then, they’d wait for a return move to retest $460 and ascertain that this ceiling has turned into a floor.
Moderate traders would be content with a move to $464, relying on just a 2% filter, then wait for a pullback for a better entry.
Aggressive traders may risk a contrarian, short position, relying on the presumption that positions had been building after two failed attempts at overcoming the $460 level in April and May, with the RSI’s projecting a weakening advance since the February highs. Patient traders would wait for a lower close today, then short if it’s lower than Friday’s real body. Then, depending on their preference, they could wait for the price to retest the Hanging Man highs for a better entry.
The downside is that the market won’t necessarily do this. It might drop instead, leaving traders to chase the trade, give up, or go short after confirmation of the Hanging Man candle. This would not give rise to the risk of having to either chase, or lose the trade, if there is no return move. But it does require a much larger stop-loss, or traders risk being whipsawed out of their position.
Trade Sample, Aggressive Short
- Entry: $450
- Stop-Loss: $456 – above the May 19 high
- Risk: $6
- Target: $402 – above the psychological $400 round number and the location of the April and May lows
- Reward: $48
- Risk:Reward Ratio: 1:9
