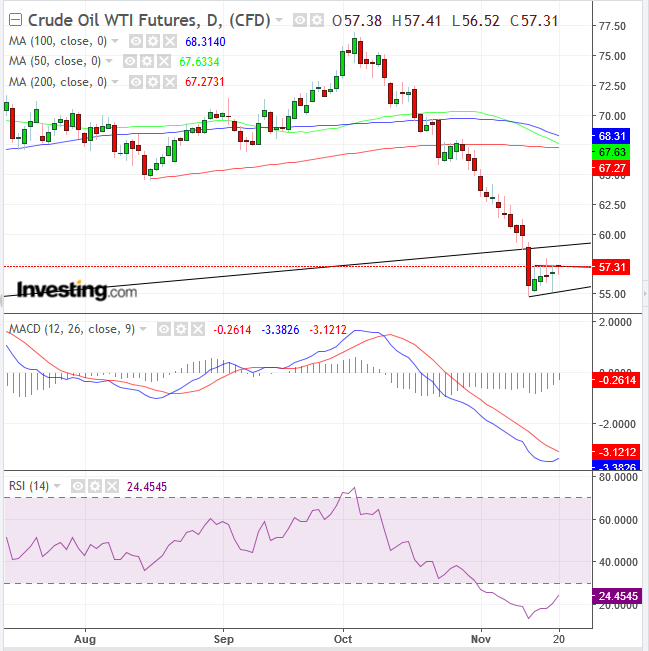
There's a double whammy weighing on oil markets right now—increased supply alongside reduced demand. Added pressure on one side of the scales would naturally have caused a price move, but when both sides of the balance equation are triggered simultaneously the results can be exceptional...in this case exceptionally negative, with an almost 30 percent plunge in the price of crude over the six weeks between October 4 and November 13.
On the supply side, US production has soared by almost 25 percent this year, to a record 11.7 million barrels per day. On the demand side, a growing consensus of an economic slowdown—which has prompted the current equity rout—sharply reduced demand for two reasons:
- A slowing economy shrinks the likelihood of infrastructure building as well as overall manufacturing and
- Traders become wary of risk assets, something oil most assuredly is.
The current environment has led money managers to sell the most contracts for the commodity in five years. The risk-off sentiment is also outweighing any expectations for OPEC supply cuts.

Last week we posted a bearish technical outlook for oil, though we expected an upward correction within the downtrend. We now believe the correction, a technically motivated return move, might be over. Even if the price might still range a bit, we anticipate a potential return toward $56.
Trading is now forming a flag, bearish after a sharp decline. The psychology behind the pattern is one in which traders suddenly feel that the market has gotten ahead of itself and has gone too far, to fast. The market then takes a breather, wherein traders take profits and wait for the next move, to either confirm the downtrend or refute it. The downside breakout signals a resumption of the selloff.
If a sharp move followed by a pause is a precursor to a continued drop, this longest losing streak on record for oil is the ultimate setup for the definitive bearish flag. As such prices will continue lower.
Trading Strategies
Conservative traders should wait for a downside breakout followed with a minimum 3-percent penetration and/or 3-days beneath the pattern, to filter out a bear trap. Then, they should wait for a likely return move to retest the pattern, with at least one long, red candle, following a green or small candle of any color.
Trade Sample:
- Entry: $55, after falling to $54, then correcting upward toward the flag, then a fall back, as described.
- Stop-loss: $58, the high on November 16
- Risk: $3
- Target: $43, based on measuring the “flag pole,” the sharp move preceding the flag.
- Reward: $12
- Risk-Reward Ratio: 1:4
Moderate traders would be content with a 2 percent penetration and/or a two-day filter. They may wait for a return move to lower exposure, but not necessarily as a trend confirmation.
Trade Sample:
- Entry: $55, after falling to $54.50, then correcting upward toward the flag, as described.
- Stop-loss: $58, November 16 high price
- Risk: $3
- Target: $43, based on measuring the “flag pole,” the sharp move preceding the flag.
- Reward: $12
- Risk-Reward Ratio: 1:4
Aggressive traders may short immediately, relying on the resistance of the pattern-top and/or the broken uptrend line below $60.
Trade Sample:
- Entry: $57.30
- Stop-loss: $58, November 16 high price
- Risk: $0.70
- Target: $55, psychological round number
- Reward: $2.30
- Risk-Reward Ratio: 1:3
