Breaking News
Get 45% Off 0
🌊 NVIDIA ripple effect: Track AI stocks' response to chip giant's earnings
Explore AI Stocks

Chart Of The Day: S&P 500 Bears Capitulate, Bulls To Push Prices Higher

By Investing.com (Pinchas Cohen)Stock MarketsMay 25, 2021 09:38
ca.investing.com/analysis/chart-of-the-day-sp-500-bears-capitulate-bulls-to-push-prices-higher-200469336
Chart Of The Day: S&P 500 Bears Capitulate, Bulls To Push Prices Higher
By Investing.com (Pinchas Cohen)   |  May 25, 2021 09:38
Saved. See Saved Items.
This article has already been saved in your Saved Items
 
 
US500
+0.02%
Add to/Remove from a Portfolio
Add to Watchlist
Add Position

Position added successfully to:

Please name your holdings portfolio
 
US10Y...
+0.54%
Add to/Remove from a Portfolio
Add to Watchlist
Add Position

Position added successfully to:

Please name your holdings portfolio
 

US stocks rose on Monday and regional shares followed today after traders' inflation concerns were calmed by comments from FOMC members and China began clamping down on speculation in commodities. The S&P 500 opened higher and closed up 1%, rising for the third out of four days.

Investor risk-appetite picked up after the Chinese government's decision to threaten industry leaders with severe penalties for excessive speculation and misinformation in the commodity market persuaded traders that any inflation as a result of a spike in commodity prices will temper. Regulators in the Asian nation have put in place a five-year plan to keep prices under control.

Then Federal officials put the spark back in traders’ eyes by reiterating that the current data is not indicative of the kind of inflation that would upend an economic recovery. Although Federal Reserve Governor Lael Brainard, Atlanta Fed President Raphael Bostic and St Louis’s James Bullard each concede that as the economy reopens, soaring demand will disrupt supply chains and probably increase prices in the next few months, they believe the current jump in inflation is transient as pent up demand will temper and prices will return to equilibrium. 

The news sent yields on the 10-year Treasury note lower for the fifth straight day, the biggest decline on a weekly basis since September 2020. Yields had been surging due to rising inflation which caused an equity selloff. With inflation-related worries easing, technicals are signaling the supply-demand balance is shifting toward buyers.
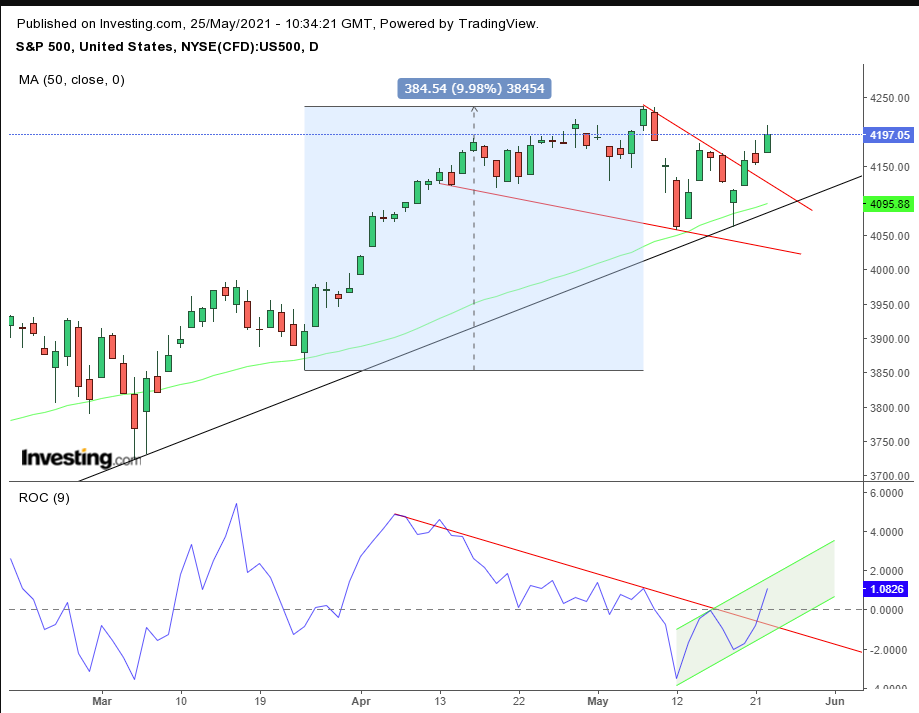
S&P Daily
S&P Daily

The price has completed a falling wedge, bullish after the 10% surge in the 6 weeks between Mar. 24 and May 7. Sellers tried to force the price down, but when buyers refused to fall into line, they gave up, allowing demand to push the price past the supply-demand range.

This pattern signals a pause and is therefore considered a continuation pattern. That is, a successful completion with an upside breakout would indicate a resumption of the underlying uptrend.

Note, the wedge bottom, which was in the form of a hammer, provided a support precisely on the uptrend line since the 2020 bottom. It was joined by the 50 DMA. The Rate of Change (ROC) demonstrated that momentum is supporting prices, as it reversed.

Trading Strategies – Long Position Setup

Conservative traders should wait for a new all-time high, followed by a dip that creates a base.

Moderate traders would wait for a pull-back for a better entry, if not for further support.

Aggressive traders could go long at will, provided they accept the higher risk of fewer confirmations that goes along with moving before the rest of the market. A coherent trade plan is paramount for trading success, especially for the more aggressive traders.

Here’s an example.

Trade Sample:

  • Entry: 4,200
  • Stop-Loss: 4,100
  • Risk: 100 points
  • Target: 4,500
  • Reward: 300 points
  • Risk:Reward Ratio: 1:3

Authors Note: This is a trade “sample,” suggesting there are diverse ways to approach this trade, even if our analysis is correct, and even if statistics will follow through favorably. You must learn how to customize a plan to your timing, budget and temperament. Till you learn how to do so, feel free to use our samples, for the purpose of learning, not profit. Or you’ll end up with neither. This is not a disclaimer. It’s a guarantee. Happy trading.

Chart Of The Day: S&P 500 Bears Capitulate, Bulls To Push Prices Higher
 

Related Articles

Chart Of The Day: S&P 500 Bears Capitulate, Bulls To Push Prices Higher

Add a Comment

Comment Guidelines

We encourage you to use comments to engage with users, share your perspective and ask questions of authors and each other. However, in order to maintain the high level of discourse we’ve all come to value and expect, please keep the following criteria in mind: 

  • Enrich the conversation
  • Stay focused and on track. Only post material that’s relevant to the topic being discussed.
  • Be respectful. Even negative opinions can be framed positively and diplomatically.
  •  Use standard writing style. Include punctuation and upper and lower cases.
  • NOTE: Spam and/or promotional messages and links within a comment will be removed
  • Avoid profanity, slander or personal attacks directed at an author or another user.
  • Don’t Monopolize the Conversation. We appreciate passion and conviction, but we also believe strongly in giving everyone a chance to air their thoughts. Therefore, in addition to civil interaction, we expect commenters to offer their opinions succinctly and thoughtfully, but not so repeatedly that others are annoyed or offended. If we receive complaints about individuals who take over a thread or forum, we reserve the right to ban them from the site, without recourse.
  • Only English comments will be allowed.

Perpetrators of spam or abuse will be deleted from the site and prohibited from future registration at Investing.com’s discretion.

Write your thoughts here
 
Are you sure you want to delete this chart?
 
Post
Post also to:
 
Replace the attached chart with a new chart ?
1000
Your ability to comment is currently suspended due to negative user reports. Your status will be reviewed by our moderators.
Please wait a minute before you try to comment again.
Thanks for your comment. Please note that all comments are pending until approved by our moderators. It may therefore take some time before it appears on our website.
 
Are you sure you want to delete this chart?
 
Post
 
Replace the attached chart with a new chart ?
1000
Your ability to comment is currently suspended due to negative user reports. Your status will be reviewed by our moderators.
Please wait a minute before you try to comment again.
Add Chart to Comment
Confirm Block

Are you sure you want to block %USER_NAME%?

By doing so, you and %USER_NAME% will not be able to see any of each other's Investing.com's posts.

%USER_NAME% was successfully added to your Block List

Since you’ve just unblocked this person, you must wait 48 hours before renewing the block.

Report this comment

I feel that this comment is:

Comment flagged

Thank You!

Your report has been sent to our moderators for review
Continue with Apple
Continue with Google
or
Sign up with Email