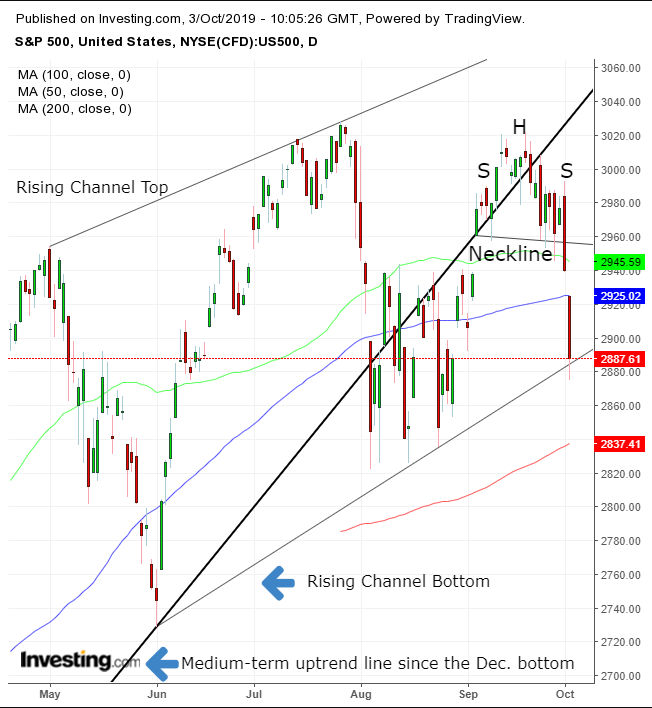
The S&P 500 is likely to make a quick upswing before continuing its decline, as U.S. data shows signs of joining the global slowdown.
Futures contracts for the S&P today opened above yesterday’s close, extending a rebound. This is in contrast to the heavy losses in Asia and the failed rally in European stocks.
Yet traders had very little to hang their hats onto yesterday. ADP private payrolls disappointed and fell to a three-month low and U.S. ISM manufacturing fell into contraction. Now the focus shifts to whether this recessionary virus has spread to the broader market.
The cracks in the U.S. data came as a sort of poetic justice after the U.S. moved to impose a reported $75 billion worth of tariffs on the EU after the WTO ruled European aircraft subsidies were illegal and gave Airbus (PA:AIR) an unfair advantage over America's Boeing (NYSE:BA).
These duties hitting Europe—along with the ongoing trade war with China—make a compelling case for recession after the longest expansion on record; it also suggests it’s time for a fall, followed by a winter. This is already indicated by falling yields.
The charts, too, are suggesting a brief rally, followed by a return to the downtrend.

The S&P’s two-day plunge dipped below, but closed above, the bottom of a falling channel since May, indicating that demand remains even after yesterday's pessimistic mood.
While this support increases the chances for a return move to a small H&S top/Island Reversal, we see the potential dip buying as short-lived because the H&S top, although small, marks the second failure to remain above the medium-term uptrend line since the Christmas Eve sell off (thick uptrend line).
After falling below the 50 and 100 DMA, a drop below the 200 DMA — which lined up with the August lows — would signal a top.
Trading Strategies
Conservative traders would wait for a fall below the 2,728.81, June 3 low — which would prove a resistance level upon an attempted follow-up rally — before committing to a short position.
Moderate traders would wait for a return move that would prove the downtrend when it finds resistance by the H&S top and falls below the 200 DMA.
Aggressive traders may risk a contrarian, long position, counting on the expected return move toward the neckline of the H&S top.
Trade Sample
