Turkey’s economy grew 7% in the first quarter, outperforming most G20 peers. However, when factoring in the exchange rate, the data tells a different story.
The country’s GDP per capita in US dollar terms plunged almost 40% since 2013 to $7,700 last year, rendering the country’s economy unsustainable as its expansion is carried by government spending and lending.
And just now, President Recep Tayyip Erdogan called for lower interest rates—a reoccurring theme going back years—against the better judgment of many economists.
The president is pandering to the populace and blaming the European Union and the US, who have enjoyed zero or near-zero rates, for the country’s economic ails.
Now, Erdogan is demanding that the central bank lower rates after he fired the bank's governor, Naci Agbal and deputy governor, Murat Cetinkaya.
After Turkey’s president made this announcement on television in March, the Turkish lira dropped to a new record low.
We expect the lira to further weaken.

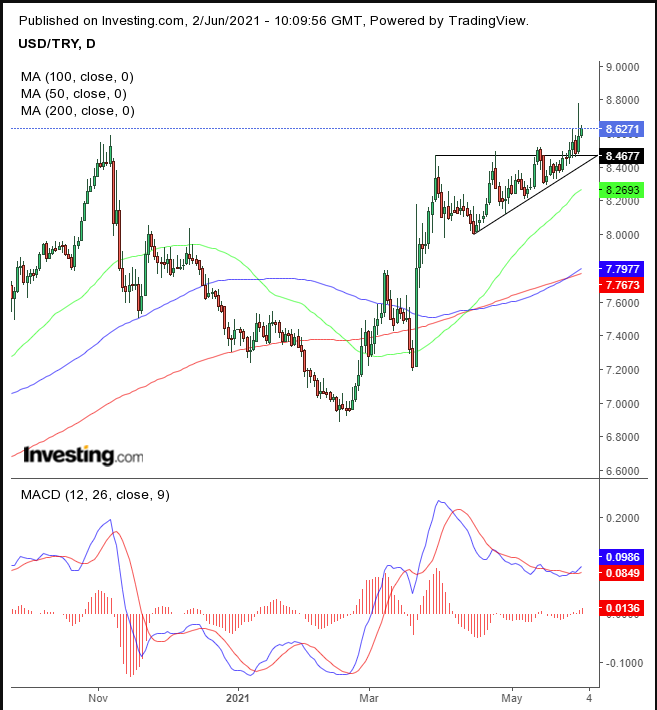
The USD/TRY completed an ascending triangle, a pattern whose dynamics are driven by buyers who are more motivated than sellers. That is why the lows within the pattern rose, while the highs were flat. When demand absorbed all available dollars, selling liras against them, buyers upped their bids, upping the ante for traders.
The upside breakout signals another leg up, as the pattern’s completion will have presumably set in motion a chain reaction. Note, that the triangle developed at the previous record high for the pair, registered Nov. 6, 2020. This bullish pattern was the market device to help bulls overcome the resistance.
So, short sellers, who expected the resistance of the all-time high for the pair to hold, because the pair couldn’t possibly go higher, are now paying dearly as the market is creating a short squeeze.
Once short coverings, buying back the asset to return to the broker, is finished, the pair could dip. Then, bulls are expected to take it back up, till finally the rest of the market is anticipated to join—adding to the demand.
The 50 DMA has been supporting the bullish triangle, while the 100 DMA recently crossed above the 200 DMA placing the three primary moving averages in a bullish formation: each shorter MA above a longer one, showing a broad uptrend.
The MACD’s short MA crossed above the long MA, showing the same thing.
Trading Strategies – Long Position Setup
Conservative traders should wait for the price to fall back to the triangle and find support, before risking a long position.
Moderate traders would wait for a buying dip.
Aggressive traders could enter at will, provided it is according to a trading plan that reflects the higher risk for the higher reward. Here’s an example:
Trade Sample
Entry: 8.6000
Stop-Loss: 8.5000
Risk: 1,000 pips
Target: 8.9000
Reward: 3,000 pips
Risk-Reward Ratio: 1:3
Author's Note: This is a trade sample for our interpretation of the forces of supply and demand based on historical statistics. We do not know the future, and if that is a problem for you, do NOT trade. Trading success is not about winning any one trade. Success is determined statistically, which requires consistent trading. You can change the parameters to suit your preferences. Until you learn how to do so, you can follow our samples, for learning purposes, not profit. Or you’ll end up with neither. Guaranteed, nor your money back.
