In 2016, Donald Trump single-handedly created a new fundamental driver for financial markets—his Twitter (NYSE:TWTR) messages. Some fund managers, even those with respected reputations, openly said that all one needs to do in order to trade effectively is read Trump's tweets.
Bloomberg even enabled its terminal to provide compilations of data and charts plotting and evaluating how Trump’s tweets affected the market.
President Trump using his Twitter account to deliver his opinions, policy positions and even hiring and firing updates to his more than 88 million followers, generated enormous publicity for the social media platform, not to mention substantial user growth. So it wasn't much of a surprise when Twitter lost $5 billion in market value on Monday, after it permanently suspended}} the president from its platform after markets closed on Friday, for inciting last week's US Capitol violence as well potentially fomenting future mob attacks.
On Monday, shares of Twitter closed down more than 6%. Is this just the start of a deep dive for the stock? Maybe not.
Mark Shmulik, internet analyst for AllianceBernstein says the selloff "feels like a bit of overreaction.” Right now, he notes, “most advertisers won’t touch anything Trump related.” In other words, the current selloff might be short-term pain for longer-term gain.
Moreover, adds Shmulik, though Trump increased platform traffic ad views, his removal ensures he'll no longer dominate the conversation. Plus, advertisers will likely feel better about Twitter being a safer place for their brand. Shumulik considers it “net positive to the company.”
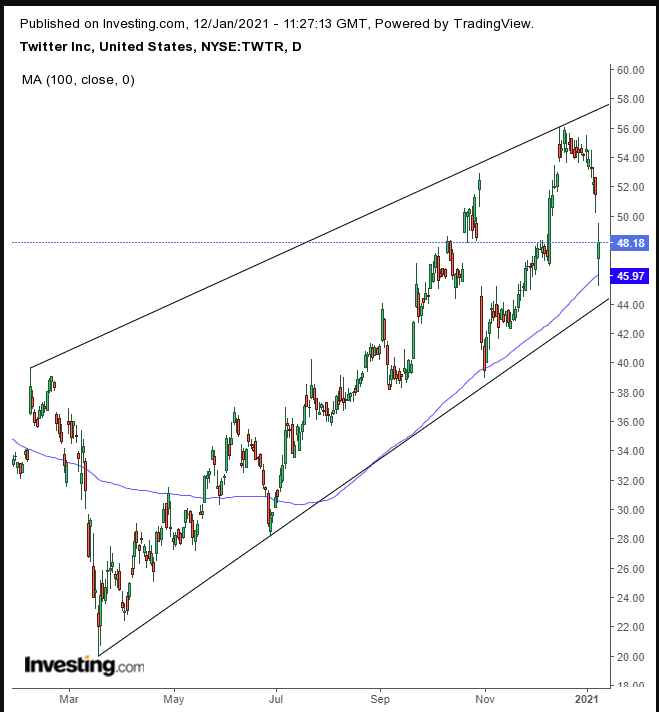
Whatever your views on the current president and Twitter’s decision, charts are indicating this selloff is nothing more than a glorified correction within an uptrend.

To begin with, there was already considerable dip-buying earlier yesterday. Indeed, a 12.2% free-fall was cut in half, to become a 6.4% decline at the close.
Second, the price found support at the 100 DMA—tracing the bottom of a rising channel, therefore confirming its technical significance. The price is trading within an uptrend, framed within a rising channel since the March bottom.
Between the March low and the December high, the price rose 180% but not in a straight line. Rather it accelerated via peaks and troughs.
On Oct. 30, the stock plummeted 21.1%, after {{erl-44334||earnings revealed weak user growth. Nonetheless, the stock didn’t just rebound after that, it added 5% to hit a record.
True, the ban on Trump has angered Conservatives, which could exacerbate the same user growth concerns that pressured the stock at the end of October, but the fact that the price found support by the 100 DMA then, and again now, and by the same uptrend line—then and now—suggests there is sufficient demand to take prices back up and challenge the all-time high. Perhaps especially when the outlook for additional fiscal stimulus will only drive investor appetite to seek risk.
Trading Strategies
Conservative traders should wait for the price to demonstrate a base above the uptrend line, then await for a retest to obtain a closer entry.
Moderate traders may wait for either the base or for greater proximity to the uptrend line.
Aggressive traders might buy in now, provided they understand and accept the risk of entering an unconfirmed position, and trade accordingly.
Here’s an example:
Trade Sample
- Entry: $47
- Stop-Loss: $45
- Risk: $2
- Target: $57
- Reward: $10
- Risk:Reward Ratio: 1:5
