Former chairman of Morgan Stanley Asia and chief economist, Stephen Roach warns that the “conditions are ripe for a sharp weakening in the US dollar in the coming year.”
The prominent economist, in fact, has been making this prediction for some time and we have been quoting him since Jun. 23. Since then we have written 5 posts, 4 of which were outright bearish and 1 provided both bearish as well as a bullish call depending upon risk aversions. Here we'll explain why another leg down is more likely than not.
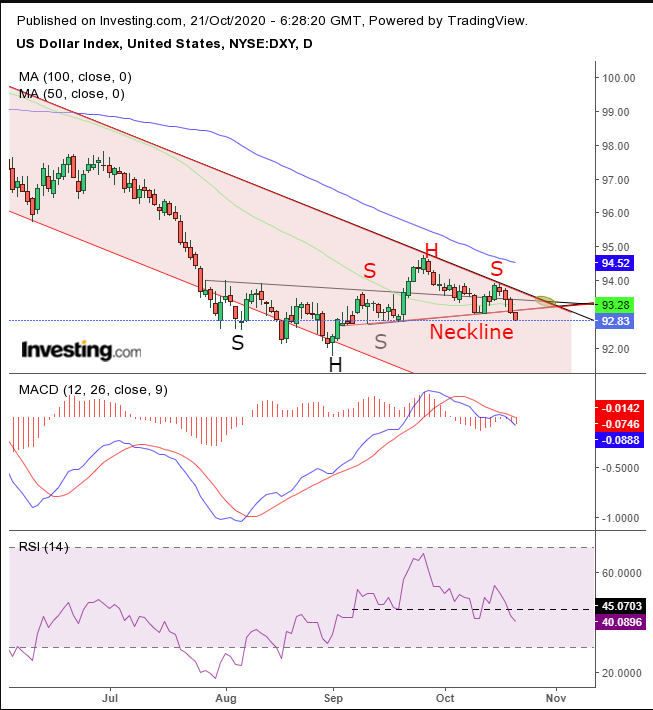
In the more recent dollar-related post on Oct. 12, we made our final bearish call after the bottom failed. Since then, the Greenback rebounded back above its reversal pattern. However, then it fell again below the pattern’s top. Today, it solidified that failure with an outright bearish pattern of its own.

We can see in the chart the H&S bottom marked in black. This demonstrates that the downtrend framed by the falling channel since the March bottom reversed, when falling peaks and troughs turned to higher highs and lows.
Such a reversal creates a chain of orders that flip momentum to the topside. We continuously cautioned that the bottom is small, and it will be hard-pressed to go against the medium-term trend.
Sure enough, the dollar attempted two rallies since the breakout, and both hit a brick wall when approaching the top of the falling channel. The price rebounded on Oct. 15 back above the H&S bottom—following the Sept. 22 upside breakout—and it dropped back below it yesterday.
Today, not only is it extending that penetration, increasing the chances for the failure of the H&S bottom—which flips market dynamics, turning the originally bearish nature of the H&S bottom into a bullish pattern—but it completed an outright bearish pattern of its very own.
The price completed a H&S continuation pattern, named as such, because it demonstrates that forces of supply and demand are recalibrating with the underlying downtrend since the March highs.
After bulls’ failed to push prices back above the 100 DMA, prices fell back below the 50 DMA, creating another technical obstacle for bulls. The MACD’s short MA failed an attempt to cross back above its long MA, and the RSI tracked the H&S continuation in the price, with a H&S top in momentum—completing a picture of continued decline.
Trading Strategies
Conservative traders would wait for another low in the falling channel, then a corrective rally to retest the current H&S pattern before risking a short position.
Moderate traders may wait for the same return-move as their conservative peers, for a better entry if not for confirmation of the trend.
Aggressive traders could short now, provided they accept the risk of a bear trap given the small penetration of the H&S continuation pattern and navigate their trade accordingly.
Here’s an example:
Trade Sample
- Entry: 93
- Stop-loss: 94
- Risk: 100 pips
- Target: 90
- Reward: 300 pips
- Risk-Reward Ratio: 1:3
Author's Note: This is just a trade sample not the analysis. That’s in the body of the post. The term “sample” suggests it’s not the only way to make this trade. There is no one truth. Different strategies can work, as long as one writes a coherent trade plan and commits to it then follows up consistently to allow himself to get on the side of statistics with covering losses and letting gains runs. Trading is not fast easy money. That’s gambling. Like any other endeavor, successful trading requires knowledge and experience.
