Trump meets Zelenskiy, says Putin wants war to end, mulls trilateral talks
Today’s biggest market-mover has been the dollar. Yesterday it fell more than 0.5%, as US stocks rallied.
Right now, the global reserve currency is pushing higher, wreaking havoc in Asia and emerging markets. A stronger dollar prompts investors worldwide to move capital to dollar assets, thereby driving them out of emerging market assets.
For some time now we've been keeping an eye on whether the dollar is topping out, and even provided a bearish call on the currency last week, based on a variety of technical triggers. Now we're also bearish on the dollar's fundamentals, for a few reasons: the US economy, the Fed's divergence from other central banks and the possible resolution of the US-China trade war.
While the US's economy appears to be peaking, we believe global markets might be nearer an economic contraction bottom. As well, we think the Fed is probably close to the end of its tightening cycle—at least for now—even as other central banks are just beginning to implement normalization. In addition, the Fed's recent accommodative flip from bluntly saying it wasn't concerned about markets to assuring investors it will be taking market volatility into account has sapped bullish energy.
Finally, an end to the US-China trade tiff would likely attract considerable investment capital to China, at the expense of the USD. The dollar's technicals currently enhance the bearish picture.

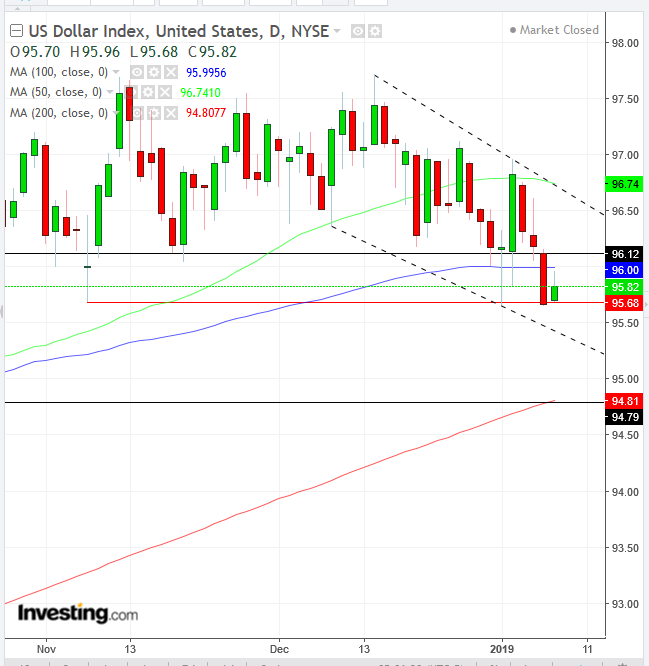
They allow for a corrective rally, before a resumption of the downtrend. And in fact, the dollar gave up its 0.3 percent gain achieved earlier today, paring that to +0.18% at time of writing.
The dollar may have topped out when it fell below the 96.00 level—whose technical significance is confirmed with the 100 DMA—a resistance level since October, which, during November, turned into a support area, as the supply-demand balance flipped with the November resistance breach. Now, with the support level break, it’s expected to turn back into a resistance.
Meanwhile, the last support of the top, the November 7 low, confirmed by thin holiday trading on January 1, is teaming up with the support of the descending channel bottom. This dual support may boost the dollar back to the 96 level, before it resumes its presumed downtrend.
The next big support is the psychological 95.00 level, supported by the mid-October low and the 200 DMA.
Trading Strategies
Conservative traders would wait for a long-term trend shift, which may occur after falling below the 93.75 levels, the July and September troughs.
Moderate traders might short when the price returns to the channel top, at the 96.50 area.
Aggressive traders may enter a contrarian, long position, counting on a corrective rebound. Then, they could join moderate traders with a short.
Trade Sample:
- Entry: 95.75
- Stop-loss: 95.65, below yesterday’s low price
- Risk: 10 pips
- Target: 96.05
- Reward: 30 pips
- Risk-Reward Ratio: 1:3
Which stock to consider in your next trade?
AI computing powers are changing the Canadian stock market. Investing.com’s ProPicks AI are winning stock portfolios chosen by our advanced AI for Canada, the US, and other exciting markets around the globe. Our top strategy, Tech Titans, nearly doubled the S&P 500 in 2024 - one of the most bullish years in history. And Beat the TSX, designed for broad market exposure, is showing +878% gains with 10 years’ back-tested performance. Which Canadian stock will be the next to soar?
Unlock ProPicks AI