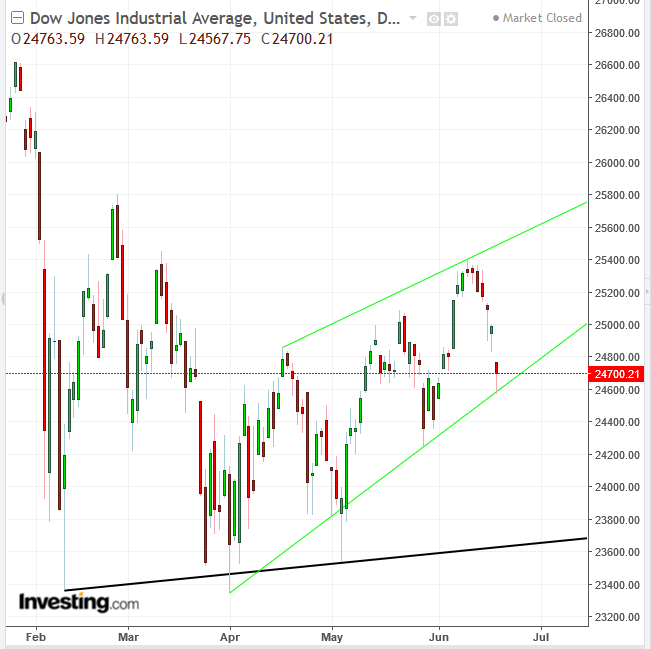
If a recent barrage of geopolitical risk—including more hawkish Fed tightening on the horizon and the ongoing escalation of a brewing trade war between the US and China that yesterday weighed heavily on global markets—could not pull the broader US indices out of their uptrend, we expect them to continue climbing. This is particularly significant for the Dow Jones Industrial Index, whose 30 multinational, mega cap companies have the most to lose from trading partners imposing tariffs on exports.
Though US markets have been whipsawed on a daily basis by the headlines, any dips appear to have been corrective in nature. Unlike Asian and European equity benchmarks that have entered downtrends, collective US investor commitment to equities appears to be steadfast. To get a better sense of this, and a clearer view of the Dow's overall trajectory, its helpful to take a step back and consider the bigger picture:

Yesterday the Dow pared a 1.65 decline to close well off its lows with a 1.15 percent loss.
Far more importantly, however, is the location on the map where the rebound occurred: right on the lower boundary of a rising channel – the range of the uptrend – since early April. That demonstrates there's a loyal clientele for the asset, traders that have been driving up prices along the channel, buying into the dips at the shallowest part of the rising range, where prices are the lowest.
Indeed, since the trade war began, major indices generally rebounded just days after each announcement, making those trades very profitable. Until that pattern breaks, we can expect traders to continue buying into dips.
Traders getting in at the low of the session, then bidding prices up to a much higher close from the open formed a hammer, demonstrating that there are still bulls in this market. Furthermore, this is the third such daily trading pattern so far this week.
Clearly there are forces awaiting lower prices in order to 'stock up.' The test now that prices have reached the lowest part of the rising channel, however, is whether these traders will allow the price to fall below it, signaling a potential reversal, at least to the February lows.
Alternatively, these bargain hunters could continue to bid up prices toward the channel top, as they have been doing since February, posting a peak above 25,400 and extending the rising channel.
Trading Strategies – Long Position Setup
Conservative traders would wait for a new peak in the long-term trend, above the late January peak above 26,600.
Moderate traders may risk a position upon a dip toward yesterday’s low, or at least to the channel bottom.
Aggressive traders might buy immediately, providing they can afford a stop-loss below 24,567.75, yesterday’s low, or risk losing the position.
Equity Management
Whatever your risk level, ensure an advantageous risk-reward ratio of at least 1:3.
Trade Example:
- Entry: 24,700
- Stop-loss: 24,565 – below yesterday’s low Risk: 135 points
- Target: 25,400 – June Peak Reward: 700 points
Risk-Reward Ratio: 1:5
