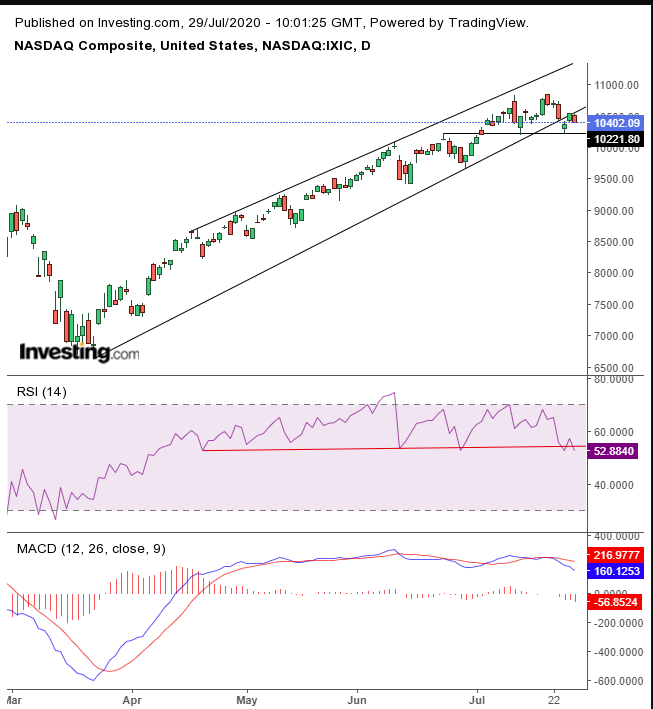
The NASDAQ is up 15.9% so far this year. Just a week ago, the year-to-date gain was 20.8%. Contrast that with S&P 500 Index, down 0.4% for the year, or the Dow Jones' 7.6% loss in the same period. Or the Russell 2000's 11.9% decline since the beginning of the year.
Also, when analyzing the S&P 500 index sectors, technology jumps off the page, having gained 15.2%, tracking the NASDAQ. It is one of only four sectors in the green for 2020, barely a third of the total, and shows double the gains of the runner-up, the consumer discretionary sector, which is up 7.7%.
On the one hand, technology stocks are thriving, based on an expectation that millions of people will continue to work from home, order goods and groceries online and so on, as the COVID-19 pandemic rages on to the detriment of the economy. But on the other hand, consumer discretionary stocks—which typically underperform in times of economic difficulty, as consumers tighten their belts—are outperforming.
You can’t have it both ways. Do investors see an increase in activity because of the famed V-shaped recovery and economic boom, or do they expect people to be stuck at home and unable to create said economic boom? This is what we call cognitive dissonance. And we see this conflict between equities trading near their pre-pandemic highs, while safe haven assets such as gold and government bond prices also hit record highs.
The question we find ourselves asking is whether the tech industry can maintain this unbridled outperformance. Let’s see what story the chart tells.

The index began trading within a rising channel after bottoming out in March. On Friday, however, it fell out of the channel. On Monday, it climbed back, but encountered resistance at the lower end of the channel. Perhaps the rise was the result of a short squeeze. Either way, there was more money unwinding positions than creating them. That resistance was confirmed with Tuesday's selloff. And here we are.
Yesterday marked the third straight day on which bulls failed to re-enter the rising channel. Meanwhile, the RSI shows that momentum has topped out, as it often does before the price does the same. The MACD, too, suggests falling prices. If the price falls another 2%, it will have completed a month-long top. Major tops usually take at least 3 months, but these times are anything but "usual."
Trading Strategies
Conservative traders will wait for a minimum 3% penetration below 9,900 and at least a 3-day filter, preferably to include a weekend; then, patiently wait for the likely return-move to retest the 10,221 neckline, before risking a short position.
Moderate traders would follow the same breakout pattern as that of conservative traders, but are likely to be patient enough for just a 2% decline to 10,017, a 2-day penetration, and a corrective rally for a better entry point, if not for a pattern retest.
Aggressive traders are likely to be content with a 1% neckline penetration, below 10,200, knowing they risk being whipsawed and are prepared financially, and mentally, to absorb this risk. Alternatively, they may short rallies that the Fed, or any other driver, triggers.
Trade Sample – Very Aggressive Short Position
- Entry: 10,400
- Stop-Loss: 10,600
- Risk: 200 points
- Target: 9,800
- Reward: 600 points
- Risk-Reward Ratio: 1:3
Note: This trade sample is very aggressive and is therefore not for everyone. We have no way of knowing whether it would be successful, but are simply “playing the odds.” We don’t even attempt to win each trade, but aim to get on the side of statistics and provide positive results overall. Moreover, this exercise is simply for educational purposes, demonstrating how to build a reasonable trade plan.
