Happiness can often be thought of as a function, where expectation equals reality. If that is the case, then the deep disappointment in China’s current economic performance is understandable, as the fervor that was present at the beginning of the year for the reopening of the economy has dissipated.
China’s slowing economy
Presently, China’s economy is showing signs of a significant economic slowdown, after decades of exponential growth. With the much-anticipated post-pandemic recovery failing to materialize, the hope that China’s reopening would be a boon for global growth has not lived up to expectations many anticipated. Instead, the government must come to grips with how to manage a vulnerable property sector, sluggish consumer spending, rising youth unemployment and increasing local debt.
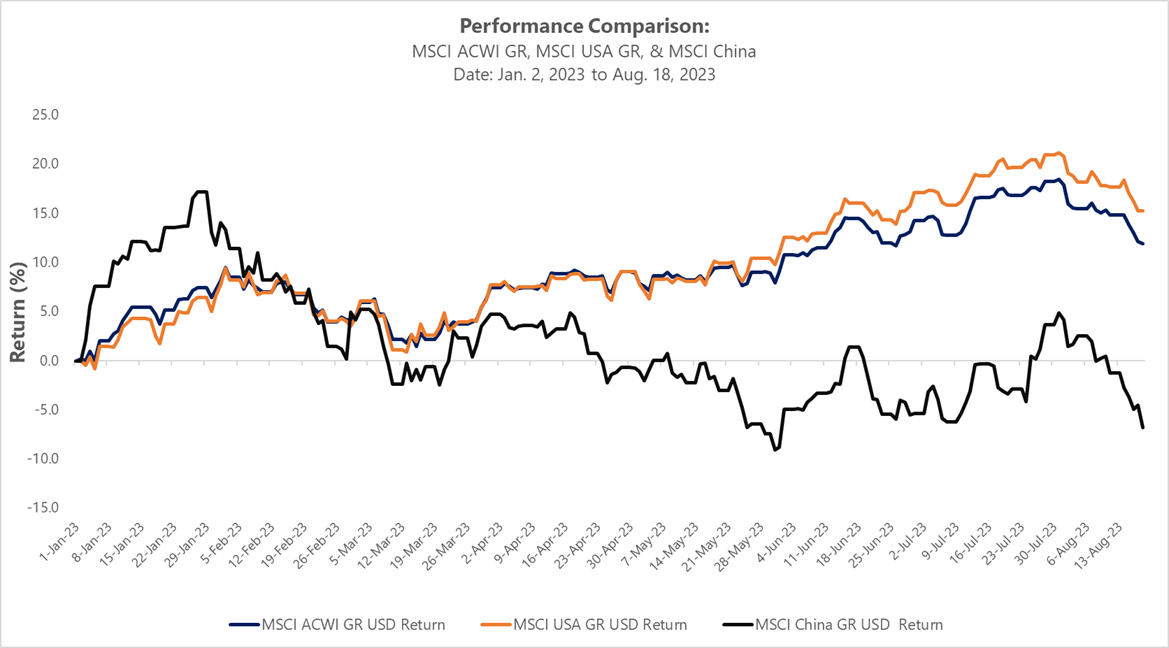
As a pessimistic sentiment around the world’s second largest economy gathers steam, the recent performance of Chinese equities has been reflective of the nation’s woes, especially in comparison to the US economy. As observed in the following chart, the performance of the MSCI ACWI Index and the MSCI USA Index has outperformed the MSCI China Index by a large margin, year to date, as of August 18th, 2023.

Looking across the global landscape
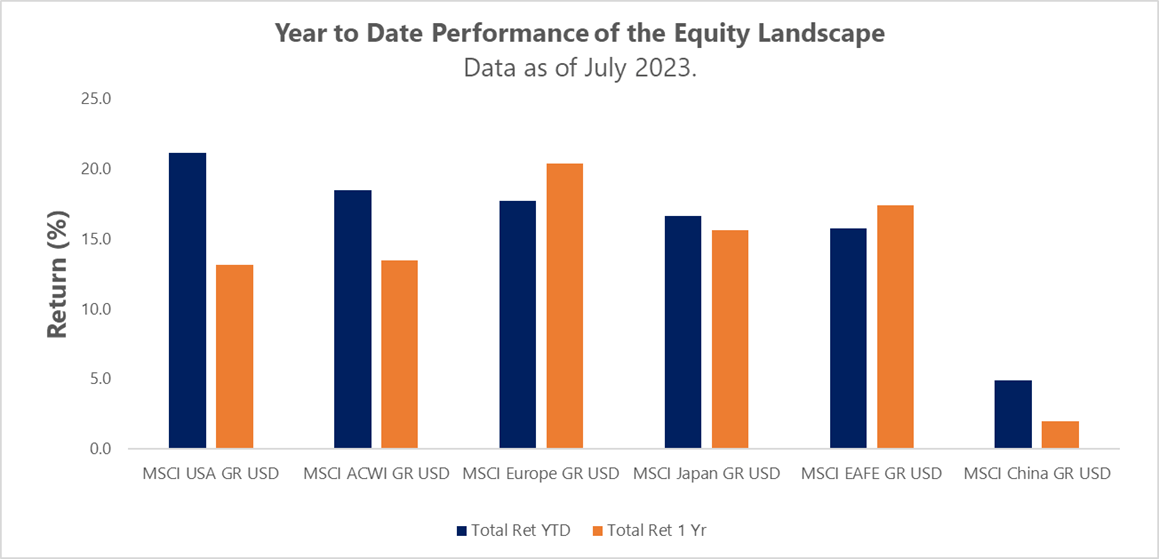
While the performance of the Chinese economy will have reverberations across the global landscape, the current performance of other equity markets is indicative of the opportunity that still exists. While the performance of US equities remains top of mind for many individuals, the year-to-date performance (as of July 2023) of Europe, Japan, and EAFE equity markets have also been compelling at this immediate juncture.

For investors looking to broaden their equity exposure, there are pure-play solutions that provide fulsome exposure to the above-mentioned equity markets. Provided below is a profile of three Canadian ETFs that capture the European, Japan, Australasia, and Far East equities respectively.
Investing in European Equities
Investors looking for concentrated exposure to the largest European companies that are sector leaders should consider Horizons Europe 50 Index ETF (HXX), which tracks the Solactive Europe 50 Rolling Futures Index (Total Return). As of July 2023, the firm’s sector exposure is broadly distributed between Consumer Goods (20.11%), Financials (19.30%), Information Technology (14.69%), and Industrial Services (14.20%). From a geographic perspective, France (41.10%), Germany (26.45%), and the Netherlands (15.15%) have the strongest presence.
Given the fund’s broad sector exposure, its holdings are equally diverse, with names such as LVMH Moet Hennessy Louis Vuitton SE, Siemens AG (ETR:SIEGn), L'Oreal SA, and Allianz (ETR:ALVG) SE being among the top ten holdings. The expense ratio is fairly low at 0.19%.
Investing in Japanese Equities
The BMO (TSX:BMO) Japan Index ETF (ZJPN) replicates the Solactive GBS Japan Large & Mid Cap Index, providing investors with access to the Japanese equities market. Regarding the fund’s sector exposure, as of July 2023, Industrials (23.47%) has the leading allocation, followed by Consumer Discretionary (19.71%), and Information Technology (14.62%).
The fund’s holdings are reflective of some established industry leaders, namely, Toyota Motor Corp, Sony Group Corp, and Hitachi Ltd. The expense ratio is 0.40%.
Investing in Europe, Australasia & Far East (EAFE) Equities
The BMO MSCI EAFE Index ETF (ZEA) replicates the MSCI EAFE Index, providing investors with access to a broad sampling of companies that are industry leaders within the stated regional areas. Given the international focus of the mandate, its sector allocation is fairly broad, with Financial (18.76%), Industrials (16.22%), Health Care (12.88%), Consumer Discretionary (12.44%), and Consumer Staples (10.00%) being of prominent focus as of May 2023.
From a portfolio holdings standpoint, many of the previous names referenced in the earlier two funds are also present in this mandate. Thus investors can utilize this ETF as a means of gaining comprehensive international equity exposure within their portfolio. The expense ratio is modest at 0.22%.
This content was originally published by our partners at the Canadian ETF Marketplace.
