To gold bears, last week’s break below $2,030 has applied a hard brake on the market’s two-month long rally. To gold bulls, all that retreat in the spot price has done is open the floodgates for more buying at the lower level that could take the glittering metal to $2,100 and beyond.
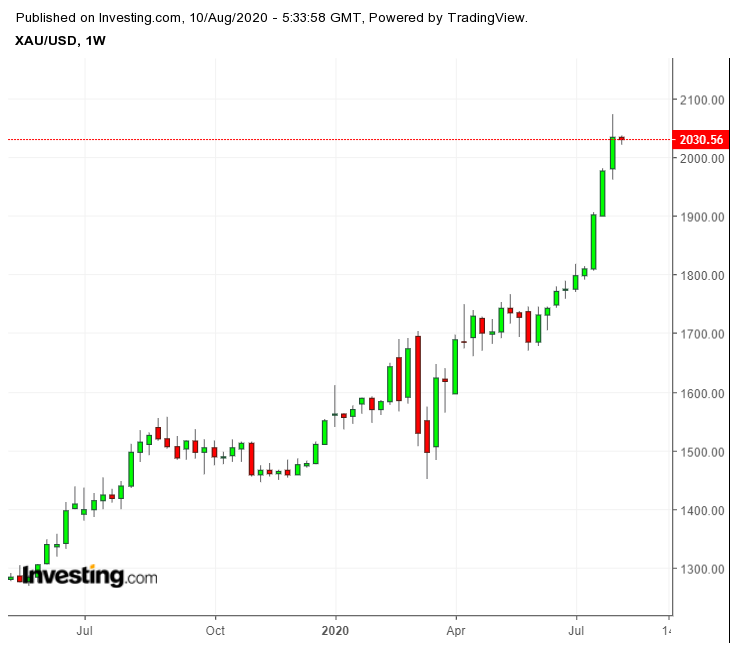
It’s been an inflection point for gold since Friday’s pivotal move that came on the back of U.S. nonfarm-payrolls data for July as it showed a third straight month of job gains—albeit at a much slower pace than June— after COVID-19 lockdowns.
“Technically, a decisive and sustained move below $2,029 could push gold lower towards $2,015-$2,000-$1,985-$1,970 and even make a case for revisit[ing] its previous all time high of $1,920,” said Sunil Kumar Dixit, an independent chartist on precious metals.
“Yet, if you’ve seen gold’s upward momentum of the past two months, you’ll see bidders rushing in at the lows to try and retest the recent record high of $2,075 on the spot contract that could eventually take the market to $2,099-$2,127 level, before the much-anticipated $2,150,” Dixit added.
Gold On The Move Higher After Friday Slide
True enough, in Monday’s early trade in Asia, COMEX's most-active gold futures contract, December, almost fumbled the support test. After debuting the day at $2,047.50, it slid to $2,028.70—just above Friday’s $2,028 settlement—before creeping up again toward its opening peak.
October, the prevailing front-month gold contract on COMEX, rose $12.60, or 0.62%, to $2,030.60 in early trade.
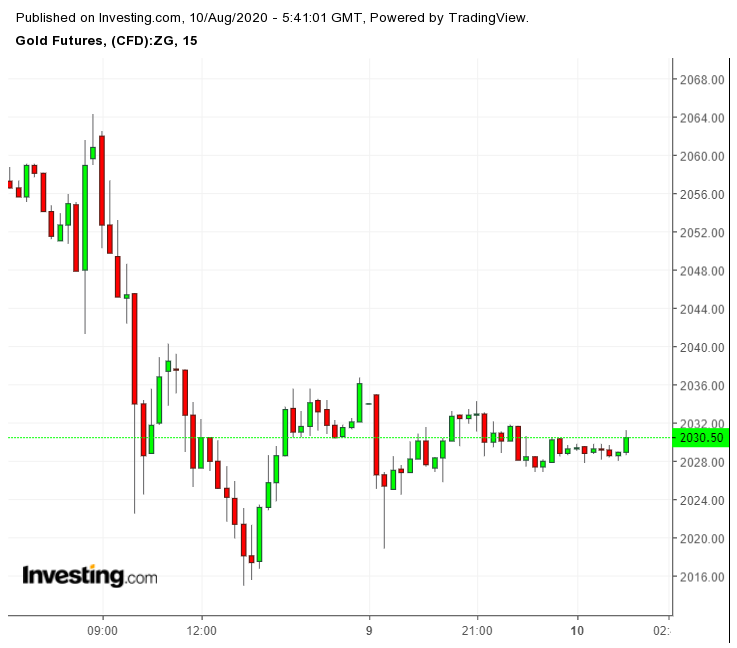
At the time of writing, December gold was still around $50 short of Friday's record high of $2,089.20. But as the momentum of the past weeks has shown, such a gap can be closed within a couple of sessions, sometimes even a day.
“With a matter as overbought and built-in (as) gold, the question must be asked for how long that pullback might continue before bulls step in?” James Staley, a technical strategist on gold, asked in a blog posted on Daily FX at the weekend.
Dollar Seen Conceding To Precious Metals’ Run-Up
That will probably be answered by the dollar, which in contrast to gold, posted on Monday its biggest upward move since March.
The Dollar Index, which pits the greenback against a basket of six currencies, has become the alternate play to gold. After the Dollar Index appeared to be on course to break the 92 reading, the yellow metal was particularly hit by Friday’s 0.7% rise on the index that propelled it above the 93 level.
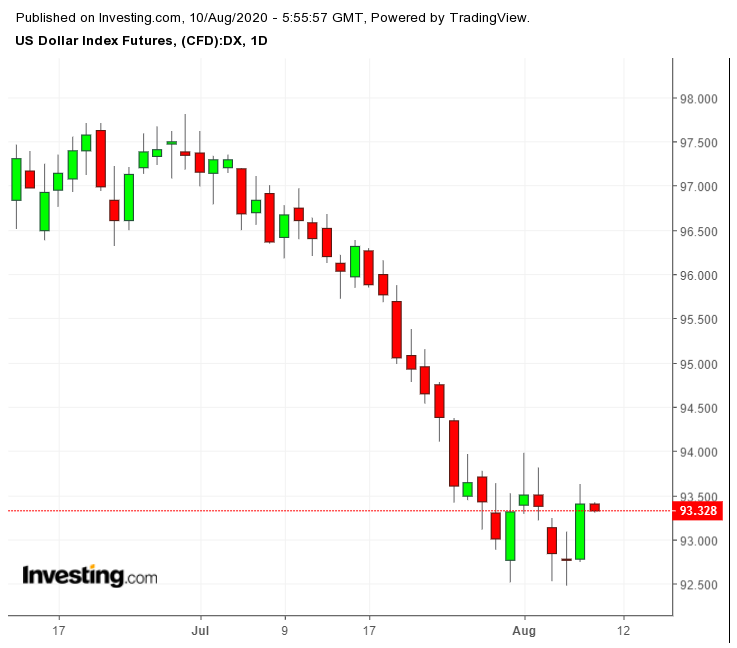
But with the resumption of the new week’s trading in Asia, the Dollar Index came under renewed pressure, signaling that gold would go higher.
“We think that USD shorts were covered ahead of this report,” TD Securities said in a forex market note for the weekend.
“A better data print now leaves the USD bid as tenuous. We see attractive risk/reward to lean short [the dollar]."
Silver, the other precious metal in parabolic mode, was also dealt a severe hand on Friday before coming back somewhat in post-settlement trade before the weekend.
Silver, The Metal Of Choice For Many
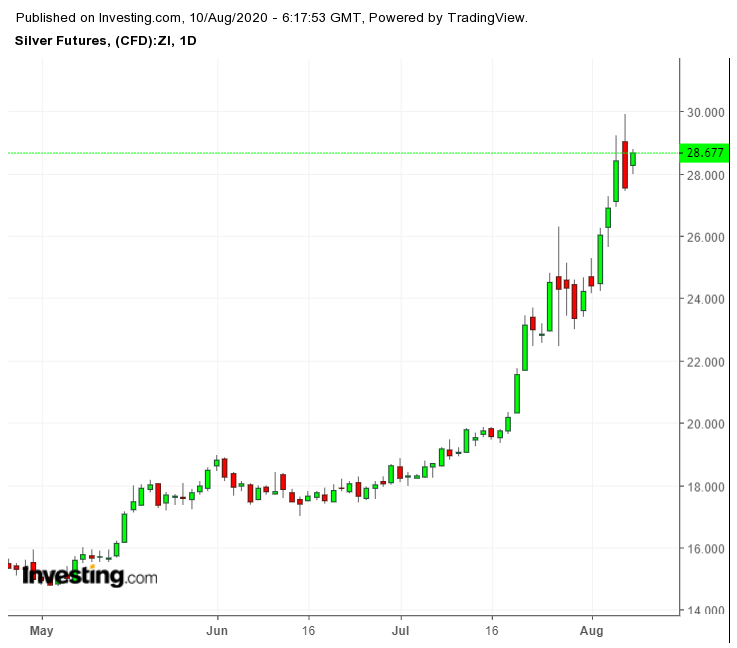
In Monday’s early Asian trade, September, the front-month silver contract on COMEX, was up 53 cents, or almost 2%, at $28.07 per ounce. It lost 86 cents, or 3%, on Friday to settle at $28.40. Before Friday's tumble, September silver hit a seven-year high of $29.915, coming just short of the $30 targeted by many longs in the white-metal.
TD Securities said in its note:
“Silver continues to outperform and remains our precious metal of choice as both precious metal flows, and industrial demand improvements combine for strong performance."
Notwithstanding Friday’s declines, gold prices are still up some 32% or more on the year. Silver, meanwhile, shows a gain of more than 55%.
Oil’s Gains Could Be Washed Out By Virus’ Woes
In the case of oil, any price advances for the week are expected to be moderate or washed out by global concerns over the coronavirus.
The rise in COVID-19 infections remains the dominant issue for the fuel demand outlook, pushing U.S. West Texas Intermediate crude down almost 2% on Friday and its London peer, Brent, 1.5% lower.
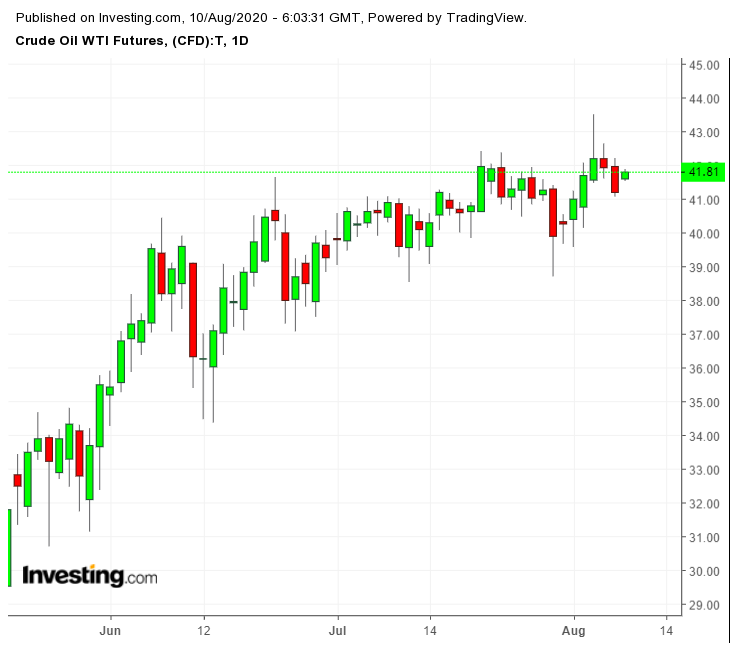
In Monday’s Asian trade, WTI was up 1.4% at $41.81 per barrel while Brent rose 1.06% to $44.87, helped by a pledge by key OPEC member Iraq to deepen its crude supply cuts.
“In a normal world … I would think crude would be back in the 30s,” Scott Shelton, energy futures broker at ICAP in Durham, North Carolina, said in his Friday note, referring to the plethora of bearish factors against oil
“But in the world we live in, with a tumbling USD, $2,000+ gold and GOBS of additional fiscal stimulus coming to keep the politicians in office, I think none of it matters to most people who trade oil,” he said, emphasizing the market’s disconnect from objective pricing.
COVID-19 cases in the United States are still rising in a number of states, while India recently reported a record daily jump in infections. Nearly 730,000 people have died in the worldwide pandemic.
More than 5 million Americans have been infected by the COVID-19 so far, with a death toll reaching above 162,000, according to Johns Hopkins University. A model by the University of Washington has predicted 200,000 coronavirus deaths in the United States by Oct. 1, casting doubts on economic recovery.
