This morning the UK released a series of economic updates that, in the aggregate given the global financial carnage being generated by the coronavirus pandemic, surprised to the upside. That doesn't mean of course that the numbers were good. Rather, they were simply better than markets anticipated.
For Q1, Britain's GDP dropped 2%, though -2.5% was the expectation. What did surprise to the downside, however, was the year-on-year reading: it came in at -5.8%, the worst ever figure for this timeframe on record in the UK, in the first quarter, its worst fall since the financial crisis, as the lockdowns translate into economic data.
Adding to concerns, this morning, Bloomberg reported:
The British Retail Consortium said total sales fell 19.1% in April from a year earlier, the most since its monitor began in 1995. In a further sign of the damage done by the lockdown, a Barclaycard measure of consumer spending fell 36.5% last month.
The recent market risk-on was a response to the world economies planning to reopen, but health experts around the world warn that that’s not possible before there's better management of COVID-19, a concern that's relevant for the UK as well.
The Bank of England estimates that the British economy is headed for its worst crash in 300 years. Of course, we can’t know that, and part of the central bank’s model was based on a 3% contraction, which as this morning's GDP release showed, came in only at 2%.
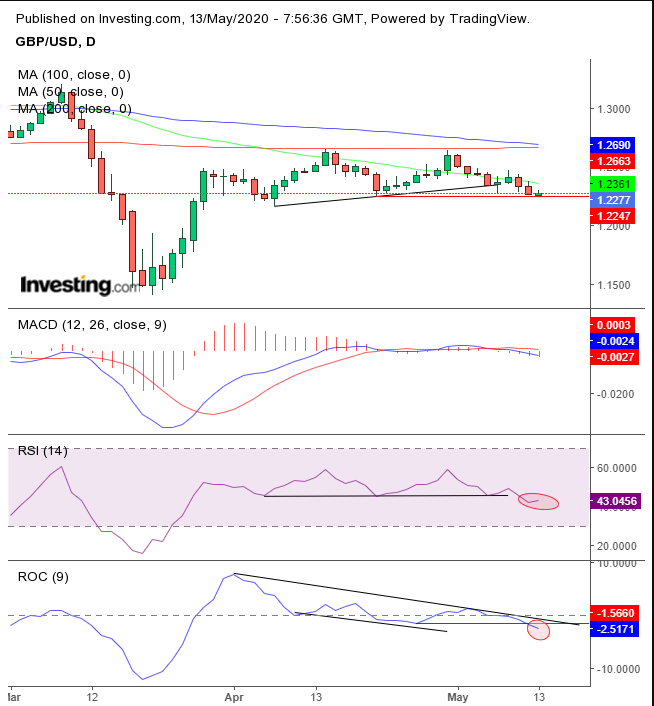
What we do know, however is that the supply-demand picture of the pound sterling is reflected in the price chart. And what we can say is that cable is headed to 1.2000. And if sellers find no demand, they will keep selling off to 1.1500.

The pound has failed to make a new high so far in May, after April’s low was unable to remain above the March high. This indicates a weakening price structure, confirmed by a falling Rate of Change (ROC), while the RSI, also a momentum indicator but calculated differently, held support.
After a lower April high, the price fell below the uptrend line that connected the lows following the March highs, completing a H&S top. Note, that the price is still above the previous, April low (red line) suggesting that at this price level there's still demand.
As all this developed, the 50 DMA fell below the 200 DMA for the first time since June, augering a 5% fall in the following two months.
The RSI, which wasn’t as sensitive as the ROC, just topped out, and the MACD’s short MA fell below the long MA, demonstrating that both various price and momentum gauges are heading lower.
Trading Strategies
Conservative traders would wait for a 3% penetration below the neckline break, preferably with a close below 1.200, then wait for the likely return move to retest pattern integrity.
Moderate traders would be content with a 2% filter, to avoid a bear trap, preferably with a close below the psychological 1.21, then wait for the same bounce as conservative traders, but not necessarily for proof that supply overturned demand. Just for an entry affording a stop-loss that’s closer to the resistance.
Aggressive traders would short at will, providing they understand that even if the pound reaches our target, it could whipsaw them out of position. As such, they'd have a laid out plan before they act—and stick to it, even at the expense of losing the position. One position should not erase your trading account but developing bad habits certainly will.
Trade Sample
- Entry: 1.2300
- Stop-Loss: 1.2500
- Risk: 200 pips
- Target: 1.1700
- Reward: 600 pips
- Risk:Reward Ratio: 1:3
