Believe it or not, the Canadian online investment community has a dedicated Reddit community for the highly popular Vanguard Growth ETF Portfolio (VGRO).
In r/justbuyvgro, Canadian investors congregate to discuss exciting investment-related developments like how much VGRO they just bought, how much in quarterly distributions they received from VGRO, and the size of their overall investment in VGRO.
However, r/justbuyvgro is just the tip of the iceberg when it comes to how popular VGRO has become for Canadian investors as a go-to, one-stop-shop.
For a 0.24% expense ratio, this ETF offers Canadians a globally diversified portfolio of 80% stocks and 20% bonds within a single ticker. Since its launch on January 25, 2018, VGRO has swelled to just over $3.9 billion in AUM, an impressive pace for a Canadian ETF.
Here's all you need to know about VGRO, along with my honest assessment of its strengths and weaknesses.
VGRO: Methodology and Construction
Like most of the asset allocation ETFs out there, VGRO uses an "ETF of ETFs" structure. This means it wraps multiple other Canadian-listed Vanguard ETFs to achieve exposure to U.S., Canadian, international developed, and emerging market equities as well as global bonds.
As of March 31, 2023, VGRO holds the following seven Vanguard Canada ETFs in these proportions:
- Vanguard U.S. Total Market Index ETF (VUN): 34.77%.
- Vanguard FTSE Canada All Cap Index ETF (VCN): 23.41%.
- Vanguard FTSE Developed All Cap ex North America Index ETF (VIU): 16.36%.
- Vanguard FTSE Emerging Markets All Cap Index ETF (VEE): 5.69%.
- Vanguard Canadian Aggregate Bond Index ETF (VAB): 11.75%.
- Vanguard Global ex-US Aggregate Bond Index ETF CAD-hedged (VBG): 4.09%.
- Vanguard U.S. Aggregate Bond Index ETFCAD-hedged (VBU): 3.93%.
Within the 80% equity allocation, VGRO begins with a heavy Canadian home-country bias via a 30% allocation to VCN (30% * 80% = 24%). Vanguard chooses to consciously overweight Canadian equities relative to their world market-cap weights, as their research suggests that this improves tax efficiency, lowers volatility, and reduces currency risk. The same is done on the bond end, with just over half of the 20% fixed-income allocation being comprised of VAB.
The rest of VGRO's 80% equity allocation is made up of U.S, developed, and emerging markets exposure via VUN, VIU, and VEE respectively. These are held according to each geography's current market-cap weights. Vanguard reserves the right to reconstitute and rebalance VGRO's portfolio from time to time at its discretion to ensure the ETF stays true to its strategy of global 80/20 exposure.
VGRO: Historical Performance
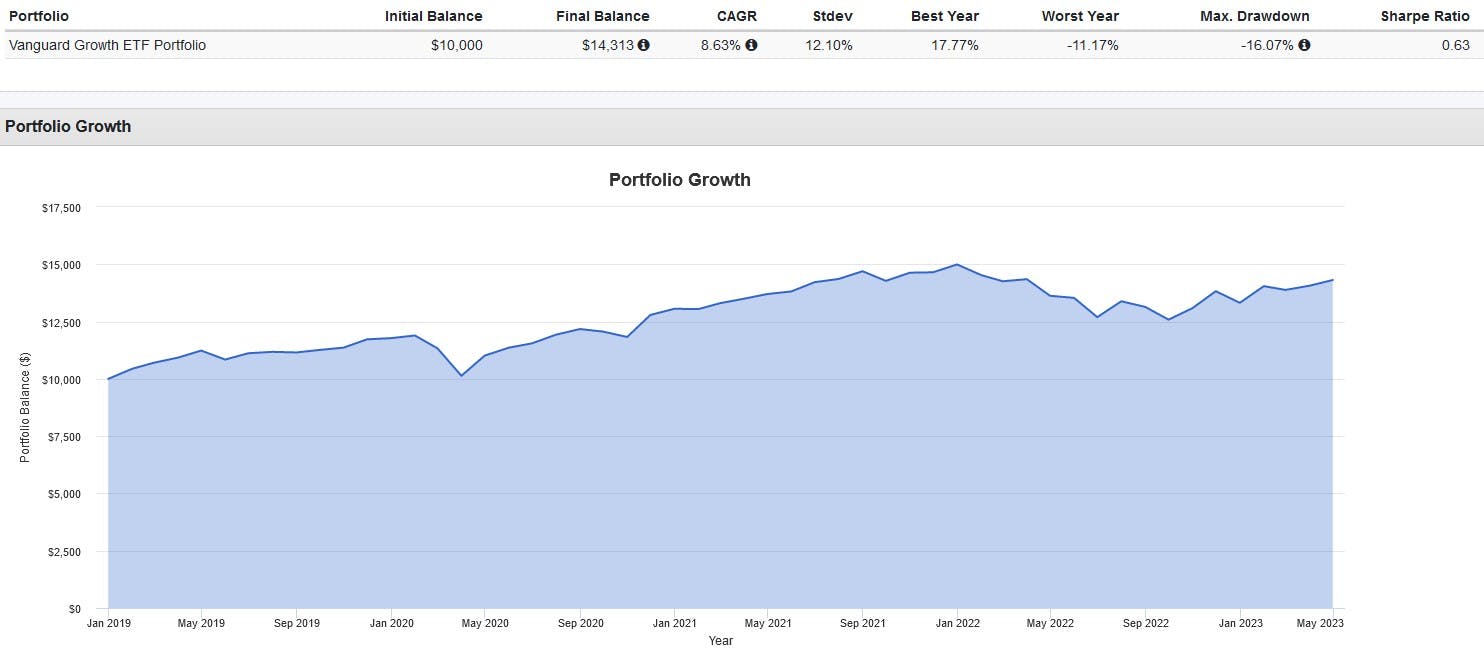
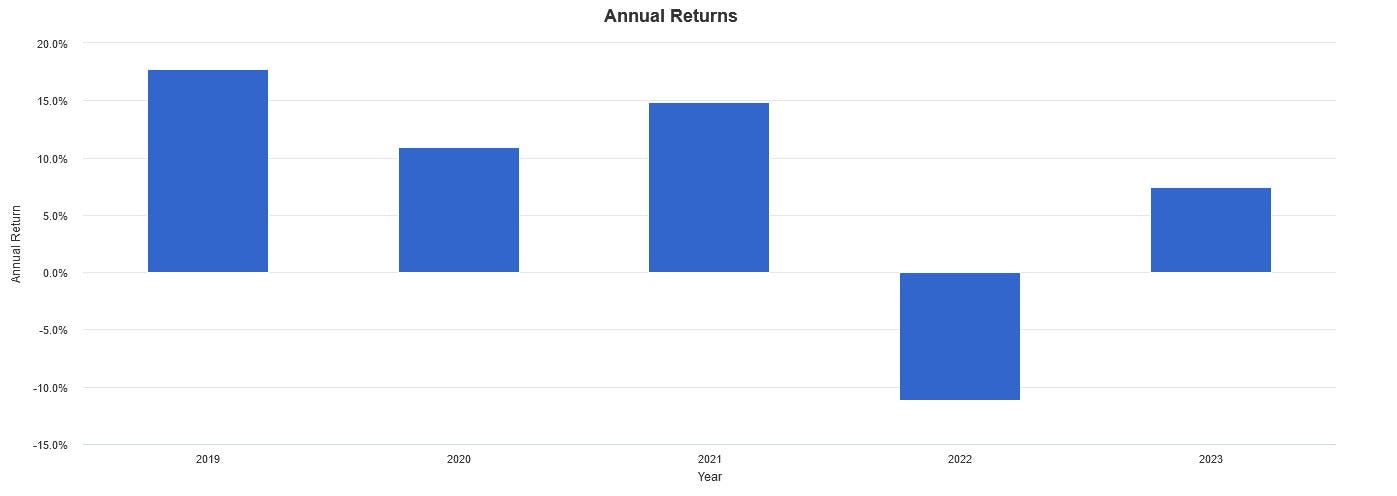
Keep in mind that this backtest is hypothetical in nature, does not reflect actual investment results and is not a guarantee of future results. It also does not account for trading commissions and bid-ask spreads.


Overall, VGRO has performed admirably since inception, returning 8.63% since inception as of April 30, 2023, with all distributions reinvested. This is a solid rate of return that combined with aggressive contributions and staying the course is more than capable of helping most investors hit their long-term retirement goals.
VGRO: Strengths and Weaknesses
No investment product is perfect, and ultimately the decision of whether or not an ETF is right for you as an individual investor should be based on your personal risk tolerance, investment objectives, and time horizon. That being said, here are some of the advantages and disadvantages of VGRO as I see it:
Pros
- Diversification: VGRO holds thousands of market cap-weighted equities and bonds from most major geographies and market sectors.
- Low costs: VGRO charges a 0.24% expense ratio, which works out to around $24 in annual fees for a $10,000 investment.
- Passive management: As an index fund, VGRO passively tracks a specific benchmark, resulting in lower costs and less potential for human error compared to actively managed funds.
- Rebalancing: VGRO automatically rebalances its holdings to maintain its target asset allocation, which saves investors the time and effort of doing so themselves.
Cons:
- Limited flexibility: VGRO has a fixed 80/20 asset allocation, which may not be ideal for investors looking for a more customized investment strategy.
- Currency risk: As VGRO holds a significant portion of non-currency hedged international assets, it is exposed to currency risk. If the Canadian dollar strengthens, the value of the international ETFs like VUN, VIU, and VEE may decrease.
- Overexposure to Canada: Despite Vanguard's rationale for doing so, some Canadian investors may dislike the overweight to Canadian equities above their world market cap weights.
- Longer duration: The 20% bond allocation in VGRO tends to have an intermediate duration of 6-8 years, which can make it more sensitive to interest rate movements.
This content was originally published by our partners at the Canadian ETF Marketplace.
Which stock should you buy in your very next trade?
With valuations skyrocketing in 2024, many investors are uneasy putting more money into stocks. Unsure where to invest next? Get access to our proven portfolios and discover high-potential opportunities.
In 2024 alone, ProPicks AI identified 2 stocks that surged over 150%, 4 additional stocks that leaped over 30%, and 3 more that climbed over 25%. That's an impressive track record.
With portfolios tailored for Dow stocks, S&P stocks, Tech stocks, and Mid Cap stocks, you can explore various wealth-building strategies.
