“Earnings don’t move the overall market… focus on the central banks and focus on the movement of liquidity… most people in the market are looking for earnings and conventional measures. It’s liquidity that moves markets.” ~ Stanley Druckenmiller
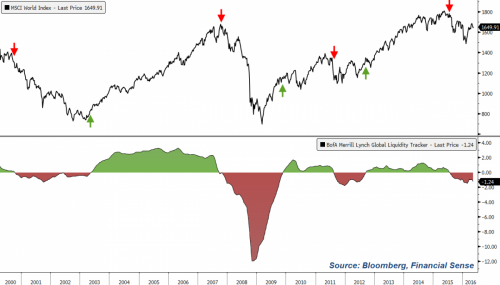
Global liquidity conditions, as measured by BofA Merrill Lynch's Global Liquidity Tracker (GLT), continue to rest in negative territory and currently appear to be heading lower. The overall message coming from this data is that global liquidity conditions are providing an unfavorable outlook for financial market stability and reflect a global economy in a weakened/fragile state. As we'll show below, most of this weakness is currently coming from emerging markets.
First, here is the description provided by Bloomberg for what BofA Merrill Lynch's GLT measures:
"Our real-time Global Liquidity Tracker (GLT) is a composite indicator of liquidity conditions in emerging and developed economies. To estimate our GLT indicator, we employ a dynamic factor model used by global central banks. Our Liquidity Tracker extracts a common unobserved factor reflecting the greatest common variation among market spreads, asset prices, monetary and credit data across different frequencies. We combine our US, Euro area, Japan and EM Liquidity trackers into a global composite using financial weights reflecting the average relevance of an economy in terms of market capitalization and private sector credit. All of this allows us to produce timely estimates of liquidity conditions in an effort to assess the state of the global economy. A reading of zero indicates liquidity at its long-run average while activity between -3 and +3 represents the standard deviation from this average."
Global Liquidity: Negative
As you can see, global liquidity conditions tend to remain positive or negative for prolonged periods of time and, in agreement with Druckenmiller, correspond with major moves in the market. We've added green and red arrows on the MSCI World Index to highlight possible entry/exit points based on positive/negative liquidity conditions.
Emerging Market Liquidity: Deeply Negative
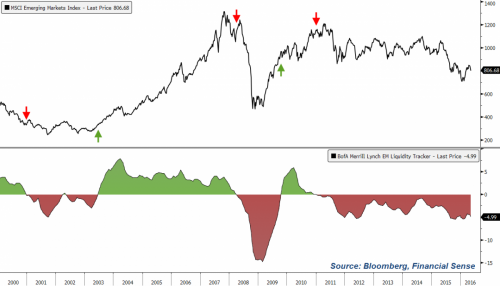
BofA Merrill Lynch's Emerging Market Liquidity Tracker is deeply in the red and currently heading lower. According to this measure, the outlook is still unfavorable for emerging market economies. MSCI Emerging Markets Index shown for reference.
Euro Area Liquidity: Fractionally Negative
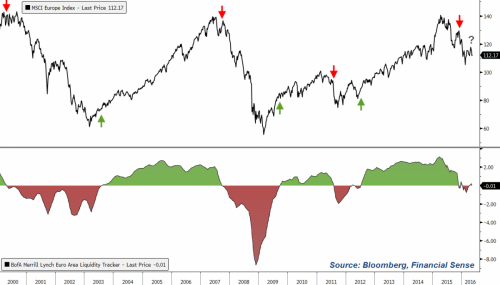
Euro area liquidity has seen a steep decline from its 2015 highs and is now fractionally negative. Though there's been a bit of volatility in BofA's liquidity measure for this region, the bias since late 2015 has been to the downside. MSCI Europe Index shown for reference.
Japan Liquidity: Positive but Falling
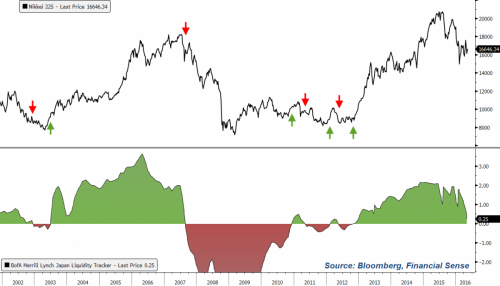
Liquidity in Japan has been favorable for their market and economy since 2012 and, although still positive, is falling quite steeply at present. Nikkei 225 Index shown for reference.
US Liquidity: Positive and Rising
The most favorable liquidity reading for each of the four major regions tracked by BofA is in the US. Liquidity conditions turned positive in January of 2010 and have remained market favorable since. Though well off the highs, US liquidity conditions are currently reading positive and rising. S&P 500 Index shown for reference with US recessions noted.
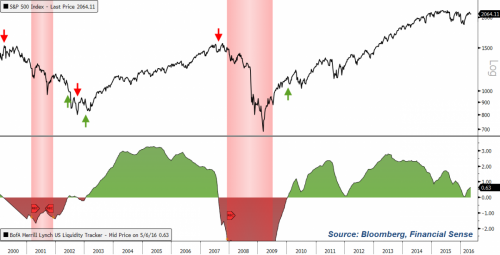
Bottom line: Overall global liquidity conditions are still unfavorable and show increased risks abroad, particularly in the emerging markets. When looking at each of the four major regions, the US has the most favorable trend at present.
