The first thing you need to do is forget the impact the February US jobs report will have on the gold price beyond today. Forget it, because the impact will most likely be what Federal Reserve Chairman Jerome Powell calls “transient”.
I say that because that’s the phrase Powell used to express his nonchalance about rising price pressures in an economy still impaired by COVID-19.
The Fed chief told a jobs event hosted by the Wall Street Journal on Thursday that there was “a difference between a one-time surge in prices and ongoing inflation", before adding that “a transient increase in inflation will not affect inflation over a longer period”.
Powell’s opinion about near-term inflation—and conviction that America will not return to maximum employment this year or soon—sent US bond yields, measured by the benchmark 10-year Treasury note, ripping higher, along with the dollar.
Share prices on Wall Street, meanwhile, cascaded as investors worried about overvaluation in high-flying tech stocks such as Apple (NASDAQ:AAPL), Microsoft (NASDAQ:MSFT) and Amazon (NASDAQ:AMZN).
Gold, already on a slow-burn meltdown over the past two weeks, got swept up in the equity market rout despite its so-called standing as an inflation hedge. The imminent Senate passage expected for President Joseph Biden’s $1.9 trillion coronavirus relief bill, which should hand the US a larger budget deficit and higher debt-to-GDP ratio—both good for gold—were ignored.
All these happened because Powell ruled out that the US central bank, under his guidance, will immediately step up bond buying to tame spiking yields. This was because of his belief that any inflationary pressure that the United States experiences this year will be transient, which should technically benefit gold. The term has become one of the Fed chief’s favorites in the pandemic era, with him using it three times in the past month alone to say he won’t be pressured into acting by temporary economic forces.
Jobs Number Will Also Be Transient For Gold
Using the same logic, I implore you to look beyond the February jobs number that will be released today if you wish to hazard a direction—or more importantly, bottom—for gold in the $1,600 an ounce territory. It will be, as Powell might describe, transient in the grander scheme of an economy still struggling to get back to optimal employment, and there are many other moving parts that will decide the outlook for risk assets and safe-havens (if gold can still be called that, something I doubted a month back).
Ostensibly, the higher the jobs growth in February, the weaker the allure for gold; and vice-versa. Yet, don’t forget that jobs are the hardest things to develop in an economy and often the last to come roaring back after a prolonged devastation. For what it’s worth, there were 227,000 jobs lost in December before an expansion of 49,000 in January. So, until they get steady, they may not necessarily be the best marker for gold.
Since there are really no credible fundamentals to hang a gold outlook on to, what is the forecast from a technical point, at least?
There are various “pain” and “relief” points for the yellow metal that multiple seers, including me, have (I’ll save mine for last).
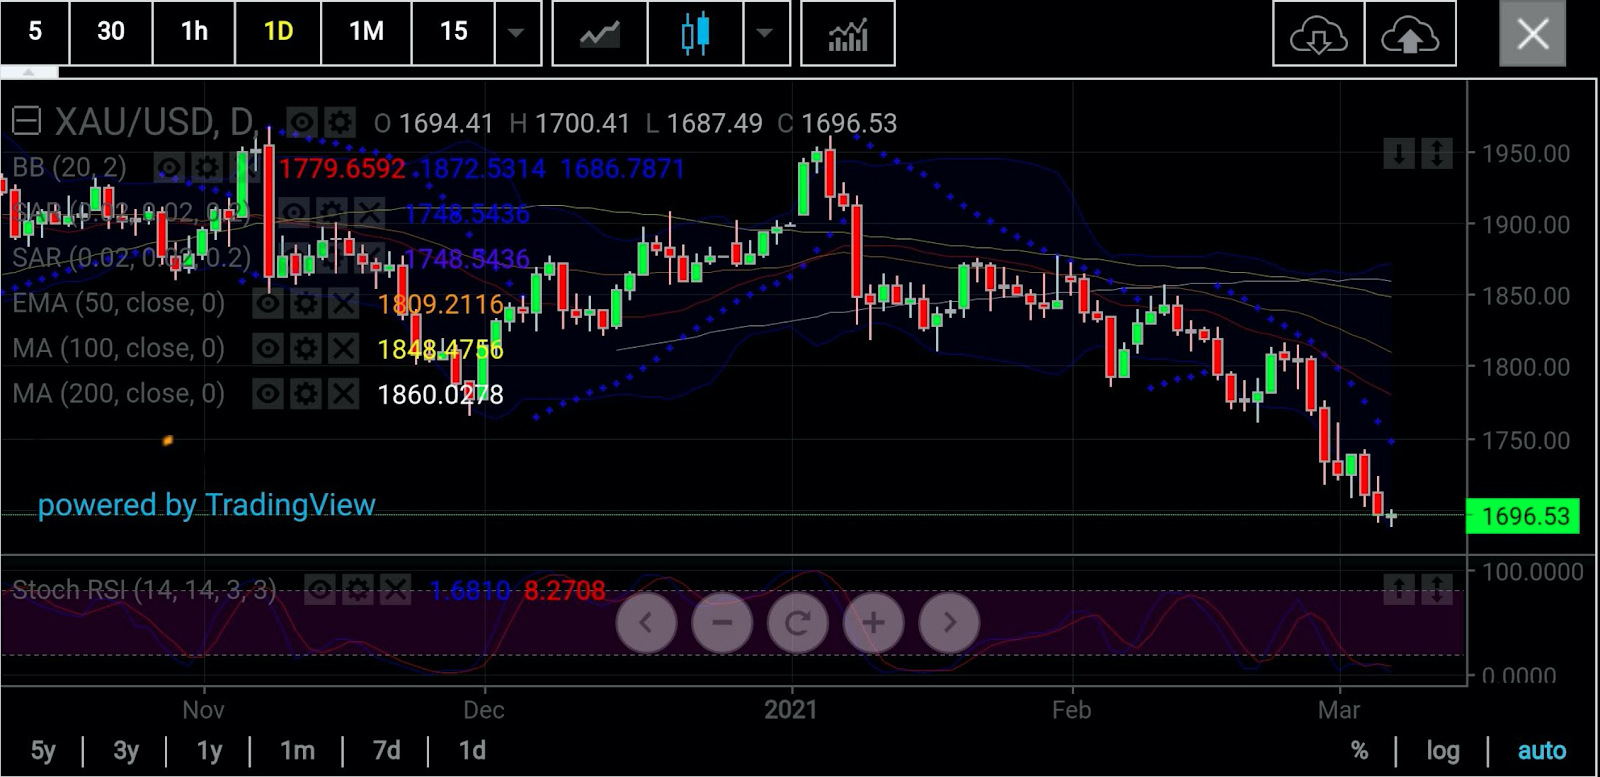
Let’s start with Sunil Kumar Dixit of SK Dixit Charting in Kolkata, India. He sees the spot price of gold, which hedge funds rely on more than futures for gold’s direction, snapping back to $1,843 at its best and cratering to $1,460 at its worst.

All charts courtesy of SK Dixit Charting
'Gold On Its Knees … Quivering'
In Dixit’s words, “gold has gone weak on its knees and is quivering”. He adds:
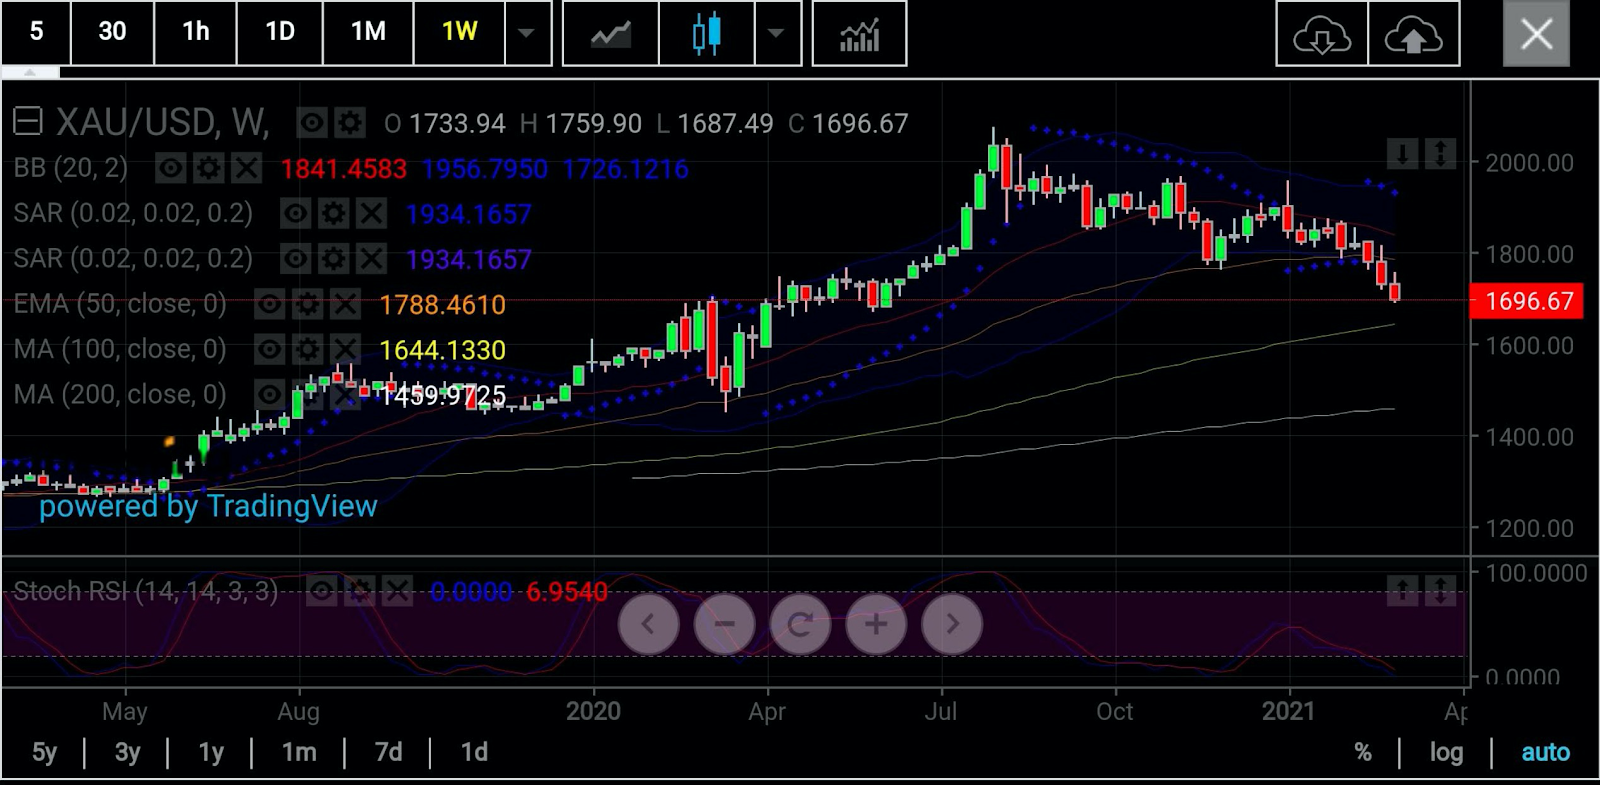
“We are not at the bottom yet. The only reliable technical support is the 100-day Simple Moving Average on weekly charts which reads $1,646. This support has enough potential to send gold back up by at least $100 or $150, if not $200.”
“The bounce back from this critical support of $1,646 can help gold retest the 50-week Exponential Moving Average at $1790 and even 20-week Simple Moving Average at $1,843.”

But only a decisive weekly close above $1,868 can signal a reliable reversal and a major bottom for gold, Dixit said.
Otherwise, graver risks await, first for bulls and later bears, he added, explaining:
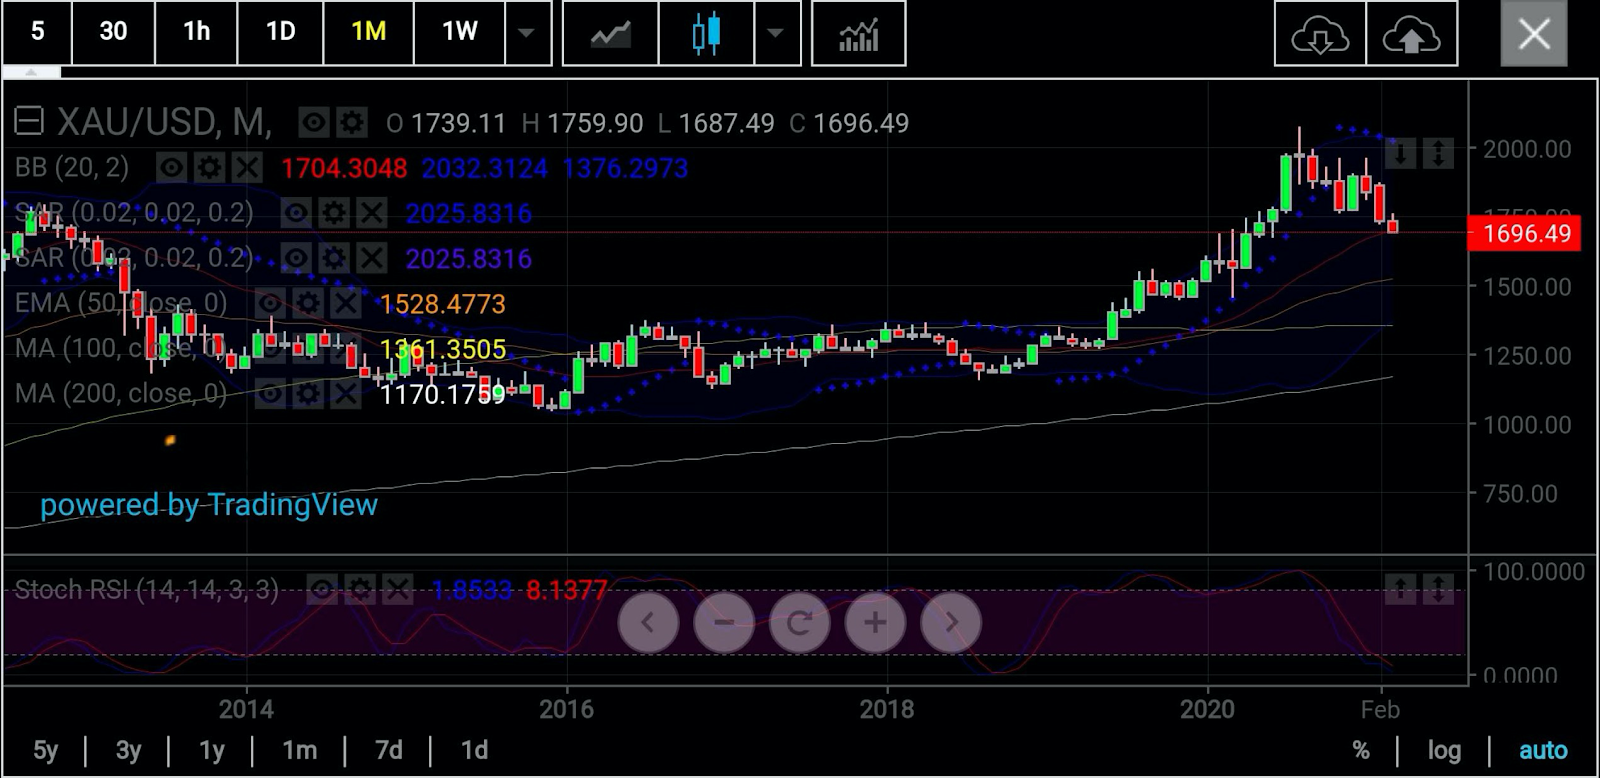
“Going by the prevailing and all-pervasive weakness in gold, the bearish streak can expose it to the 50-month Exponential Moving Average of $1,530 before the metal hits the 200 Week Simple Moving Average of $1,460. If this does happen, it will be a double bottom. This potential double bottom will result in explosive reversal to ignite the next bull rally for alarming heights.”

Notwithstanding any rebound from such levels, one thing must be remembered—a drop to $1,460 will almost completely wipe out all of gold’s gains which came on the back of COVID-19 fears. In March 2020, spot gold bottomed at $1,451.50 just before it began an epic 4-½ month rally that added nearly $600 to its price, hitting an all-time high of $2,073.41 in August.
Dhwani Mehta, in a blog posting on FXStreet, argues gold is testing the lower band of a potential falling wedge, with key support placed at $1,687.
In her notes, she says:
“A four-hour candlestick closing below the latter is needed to confirm the downside break, paving way for a drop towards the June 2020 low of $1,671.”
Jeffrey Halley, senior strategist for Asia Pacific at OANDA, notes that gold is precariously perched above its 61.80% Fibonacci support at $1,689 an ounce.
“A weekly close below that level this evening will be a significant bearish technical signal. It will set gold up for deeper losses to the $1,600 an ounce region over next week.”
An IG “client Sentiment summary” issued on Thursday meanwhile showed traders were net-long gold at a +5.85 ratio (85.41% traders long)—which, typically, is a bearish reading.
The IG note adds:
“We typically take a contrarian view to crowd sentiment, and the fact traders are net-long suggests gold prices may continue to fall. Traders are further net-long than yesterday and last week, and the combination of current positioning and recent changes gives us a stronger gold-bearish contrarian trading bias from a sentiment standpoint.”
'Strong Sell' Recommended By Investing.com
On my end, not surprisingly, Investing.com’s Daily Technical Outlook has a “Strong Sell” on COMEX gold futures’ front-month April contract.
Should the contract extend its bearish streak, then a three-tier Fibonacci support is forecast, first at $1,690.31, then $1,682.89 and later at $1,669.30.
In the event of a rebound, then a three-stage Fibonacci resistance is expected to form, first at $1,716.29, then $1,724.31 and later at $1,737.30.
In any case, the pivot point between the two is $1,703.30.
As with all technical projections, we urge you to follow the calls but temper them with fundamentals—and moderation—whenever possible.
Disclaimer: Barani Krishnan uses a range of views outside his own to bring diversity to his analysis of any market. As an analyst for Investing.com he presents divergent views and market variables. He does not hold a position in the commodities and securities he writes about.
