Last week’s review of the macro market indicators saw deep into the earnings season and with the May FOMC meeting and nonfarm payrolls in the books, equities were looking strong again. Elsewhere looked for Gold to continue in its downtrend while Crude Oil also was biased lower, but with caution for a reversal. The US Dollar Index ($DXY) was weak and moving lower while US Treasuries ($TLT) were also biased to the downside.
The Shanghai Composite ($ASHR) rounded out the list of markets looking weak as it moved lower while Emerging Markets (EEM) were biased to continue to the upside. Volatility ($VXX) looked to remain at abnormally low levels keeping the bias higher for the equity index ETF’s SPY, IWM and $QQQ. Their charts all looked stronger in the short term with the SPY (NYSE:SPY) and PowerShares QQQ Trust Series 1 (NASDAQ:QQQ) leading the way. In the longer timeframe the iShares Russell 2000 (NYSE:IWM) was at resistance while the SPY and QQQ looked set for a series of new highs.
The week played out with Gold drifting lower before finding support while Crude Oil found a bid and did reverse higher. The US Dollar found support early and moved slightly higher while Treasuries drifted lower. The Shanghai Composite continued its move to the downside while Emerging Markets continued their march higher.
Volatility held at abnormally low levels, even spending some time in the single digits. The Equity Index ETF’s held in a tight range, with the QQQ making more all-time highs as it drifted up, while the SPY made one new all-time high by pennies before pulling in. The IWM held at support, the weakest of the three. What does this mean for the coming week? Lets look at some charts.
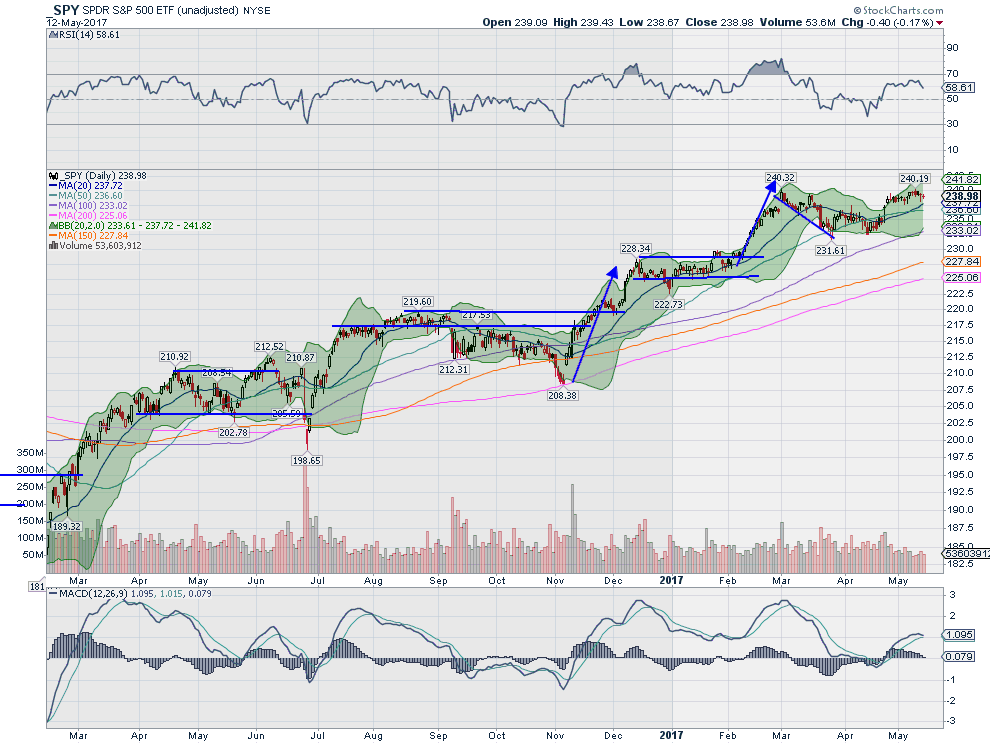
SPY Daily, $SPY

The SPY came into the week following 8 days of consolidation after a small gap up. And nothing changed the entire week. 5 more days of small range consolidation. It did manage to print a new all-time high close by pennies on Wednesday for a bright spot to the week. Low to high was just over 2 points on the week. The daily chart shows the 20 day SMA rising to meet the price. The RSI is rolling over slightly and the MACD is about to cross down. These suggest a pullback in the short run may be brewing.
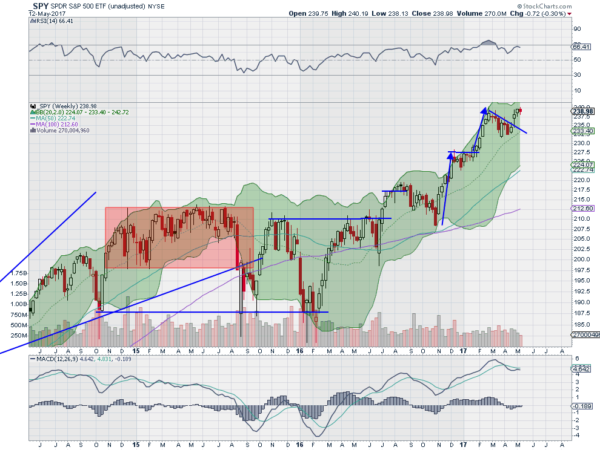
On the weekly chart there is consolidation at the high. The RSI is firm in the high 60’s and the MACD is flat after a small pullback. There is resistance at 240 and then a Measured Move to 248. Support lower stands at 238 and 237.10 followed by 236 and 233.70. Consolidation in Uptrend.
SPY Weekly
Heading into May options expiration, the equity markets look mixed with strength in the QQQ and exhaustion in the IWM and SPY. Elsewhere look for a possible reversal higher in the Gold downtrend while Crude Oil consolidates. The US Dollar Index looks to continue the drift lower while US Treasuries are biased lower in consolidation, but show the possibility of a reversal short term.
The Shanghai Composite is trending lower but also showing signs of a possible reversal while Emerging Markets continue to roar higher. Volatility looks to remain at exceptionally low levels keep the wind at the backs of the equity index ETF’s SPY, IWM and QQQ. Their charts show continued strength in the QQQ with consolidation in the SPY and IWM. Use this information as you prepare for the coming week and trad’em well.
The information in this blog post represents my own opinions and does not contain a recommendation for any particular security or investment. I or my affiliates may hold positions or other interests in securities mentioned in the Blog, please see my Disclaimer page for my full disclaimer.
