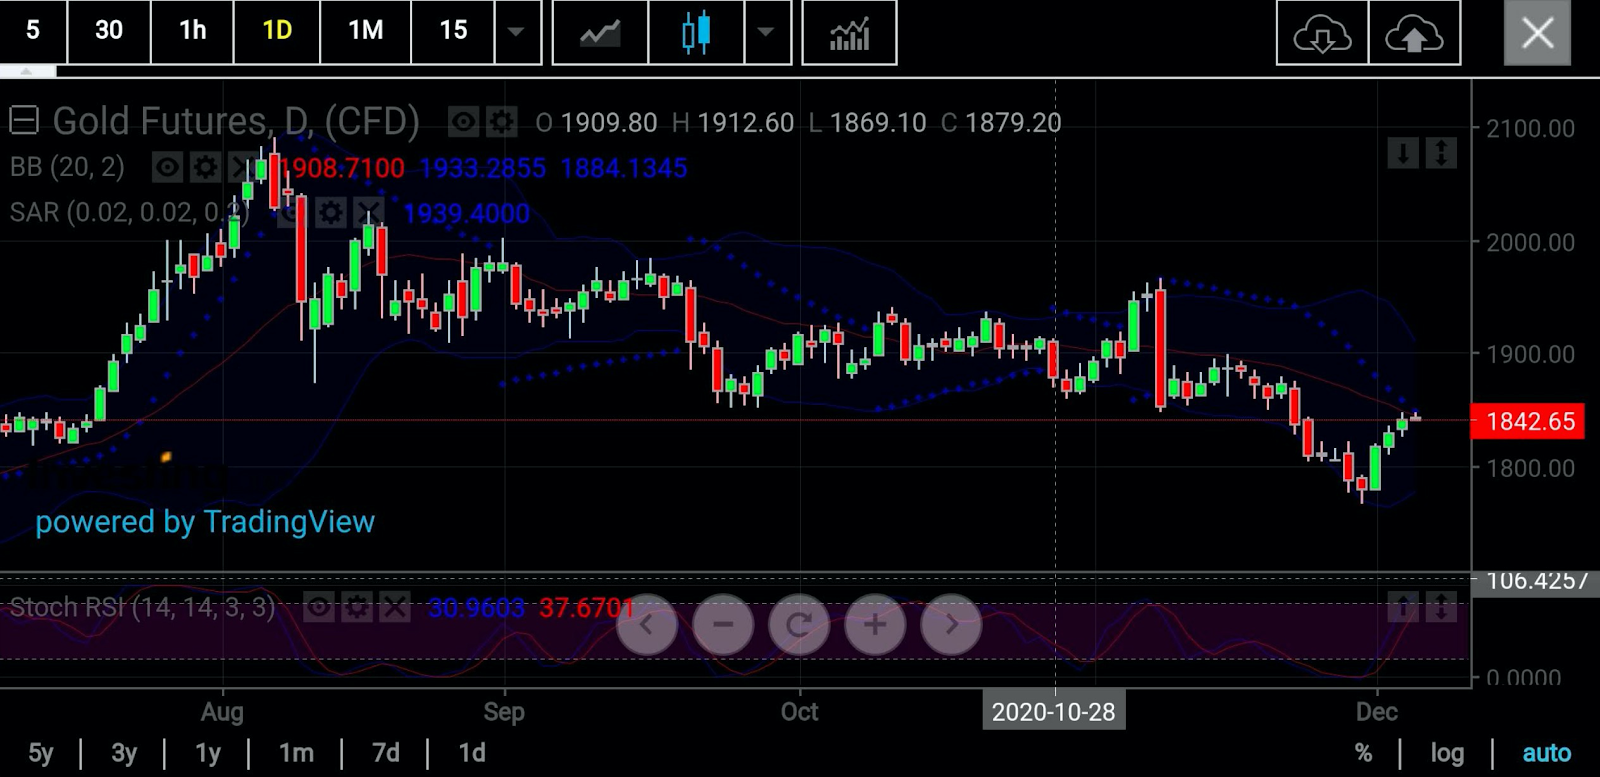
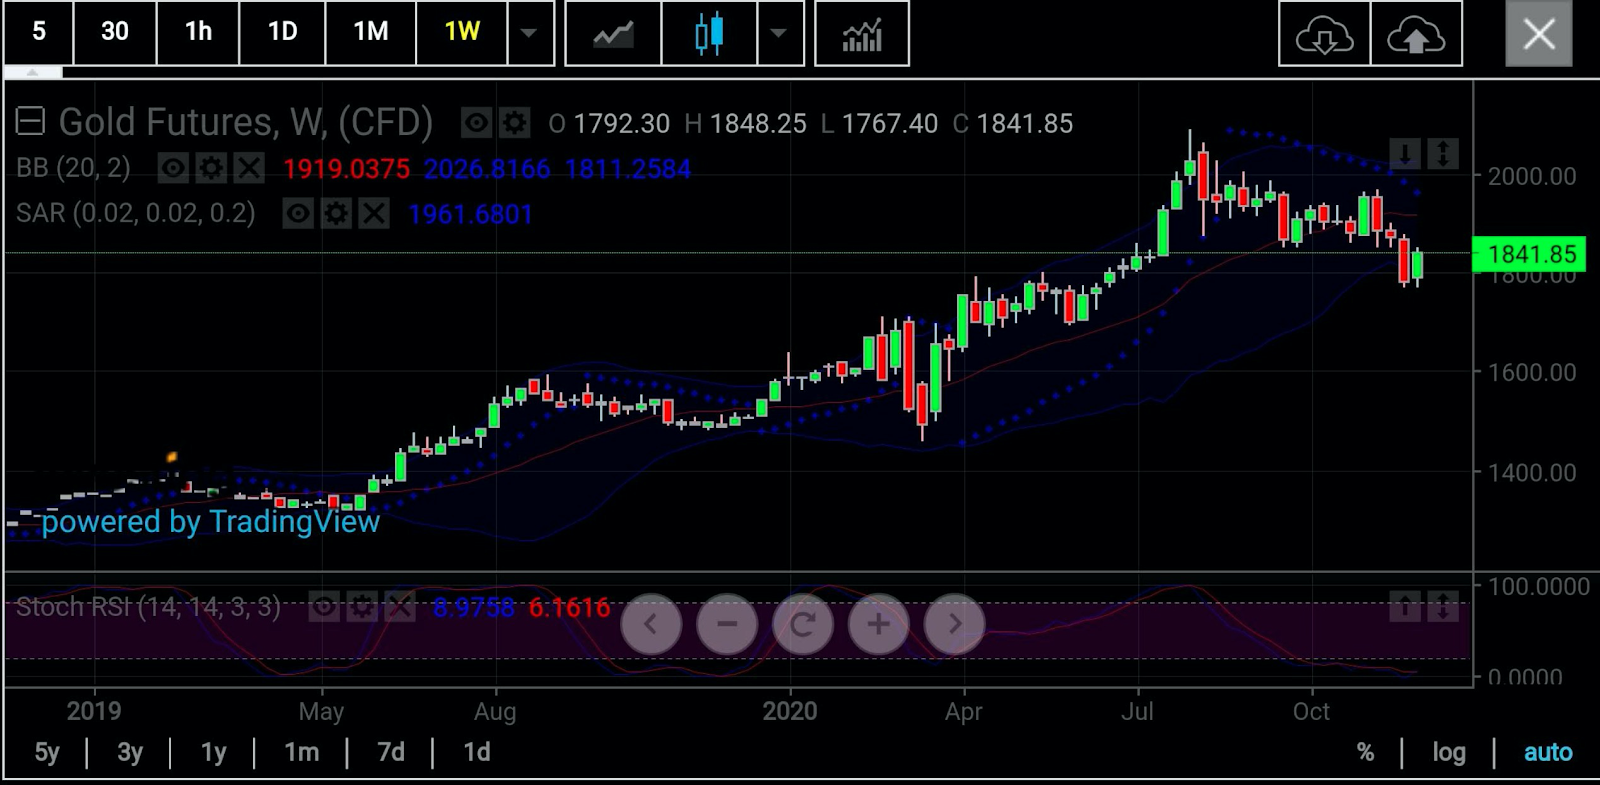
Technically, the most brutal market corrections often result in the most aggressive reversals. If that adage is to apply to gold in its bid to return to $1,900 an ounce, then consider a fundamental that could further juice that technical story: stimulus.
Gold had its most crushing selloff in two months last week, losing $90 or almost 5%, after breakthroughs in COVID-19 vaccines and their potential availability before Christmas caused a run on money in safe-havens and an epic rally in stocks amid the notion that the world might soon be free of the pandemic.
Yet, this week, gold is up nearly 4%, clawing back almost $65 to hover at $1,845 by lunch hour in Asia on Friday, or about 1:30 AM ET in New York. Vaccines are still very much the narrative in markets, but something else has come along to sweep almost everything higher at once—like the proverbial tide that lifts all boats. It is renewed talk of a second US coronavirus stimulus.
After multiple roadblocks over the past six months and other twists and turns, a bipartisan group of Republican and Democrat lawmakers, fed up of the politics that have denied millions of needy Americans aid, are demanding that Congress and the Senate pass a $908 billion COVID-19 relief bill that could be distributed right away.
If those funds aren’t enough, there’s another $455 billion left over from the original $3 trillion Coronavirus Aid, Relief and Economic Security (CARES) Act approved in March, that could also be appropriated for current use, the group said. That’s almost $1.4 trillion—somewhat short of the $2 trillion the Democrats originally sought but way above the miserly $300 billion that the Republicans offered.
For stock markets already pumped up on vaccine news, renewed talk of a stimulus has been yet another reason to hit record highs. For gold, particularly, the bipartisan initiative has been a lifeline thrown at the right time to rescue it from the $1,700 abyss it was hurtling into last week.
While few may expect the yellow metal to return immediately to the all-time highs of $2,000 and above reached in August, some aren’t discounting a return to $1,900 in the near-term.
The good news is, numerically, that target isn’t very far away—just slightly more than $50 from where gold stood at in Friday’s Asian trading.

Charts courtesy of SK Dixit Charting
Technically though, the path to $1,900 is fraught with various hurdles, says Sunil Kumar Dixit of SK Dixit Charting in Kolkata, India. In an email to Investing.com on Friday, Dixit broke down the passage that lay ahead for the shiny metal:
“Gold's body language shows its willingness to cross to the right side of $1,900, but at the same time, technical factors call for caution.”
“As expected, the precious metal is facing stiff resistance at $1,848 and Stochastic RSI (Relative Strength Indicator) negativity can cause some intraday correction to $1,830-$1,818. Buyers may come in at the test of $1,818-$1,820 areas and a consolidation may help gold to rally again, breaching $1,848 and reaching out to $1,866-$1,870.”
In short, the current upside has limited movement, said Dixit, adding:
“Whether gold will be able to reclaim its $1,968 critical barrier will be determined by the $1,915-$1,920 range.”

Anil Panchal, a gold chartist who blogs on FX Live, said technicals were immediately in the yellow metal’s favor for a test of $1,850 first:
“Having successfully cleared $1,841 confluence, comprising the Fibonacci 38.2% one-month and the Simple Moving Average of 5-15 minutes, gold buyers are well set to challenge the middle Bollinger on the daily chart and Pivot Point one-week Resistance 1 around $1,851.”
Panchal says the Technical Confluences Indicator he used also suggested $1,851 as a key upside hurdle for gold.
“Should the metal cross $1,851, Pivot Point one-week Resistance 1 around $1,857 can offer an intermediate halt before October’s low near $1,860.”
On the flip side, he warned that a downside break of $1,841 may bring a wave of sellers looking for a quick buck—first at $1,839 and then at $1,835.
Investing.com’s own Daily Technical Indicator shows that gold has turned into a “Buy” from “Strong Sell” a week ago. Fibonacci resistance emerges first at $1,846.31, then at $1,851.19 and later at $1,859.10, our models show.
Should the trend turn bearish, then gold will likely find Fibonacci support first at $1,830.49, then at $1,825.61, before full-scale buying emerges at $1,817.70.
The pivot point between these ranges is $1,838.40.
As with all projections, we urge you to follow the calls, but temper them with fundamentals—and moderation—whenever possible.
Disclaimer: Barani Krishnan uses a range of views outside his own to bring diversity to his analysis of any market. He does not own or hold a position in the commodities or securities he writes about.
