- Gold broke past the $2400 recently.
- Weakening dollar and US bond yields signal further gains.
- Based on the current scenario, bulls will eye $2500 with the next surge.
- Invest like the big funds from the comfort of your home with our AI-powered ProPicks stock selection tool. Learn more here>>
Gold prices are on a tear, breaking through historical highs above $2,400 per ounce after a brief correction in April. Meanwhile, silver has also shown promise, with strong potential for further gains even though it hasn't reached its peak yet.
The yellow metal's upward trend can be attributed to several factors:
- Weakening dollar: A declining dollar has made gold a more attractive investment, as it becomes cheaper for foreign buyers.
- Falling Bond Yields: Lower U.S. bond yields have decreased the opportunity cost of holding non-yielding gold, making it more competitive.
- Geopolitical Concerns: Lingering tensions, especially after the death of Iranian President Raisi, have added a safe-haven premium to gold.
With these supportive factors in place, analysts project further increases in gold prices. The next key target is a round number: $2,500 per ounce.
Favorable Bond Market Conditions, Weak Dollar Boost Yellow Metal
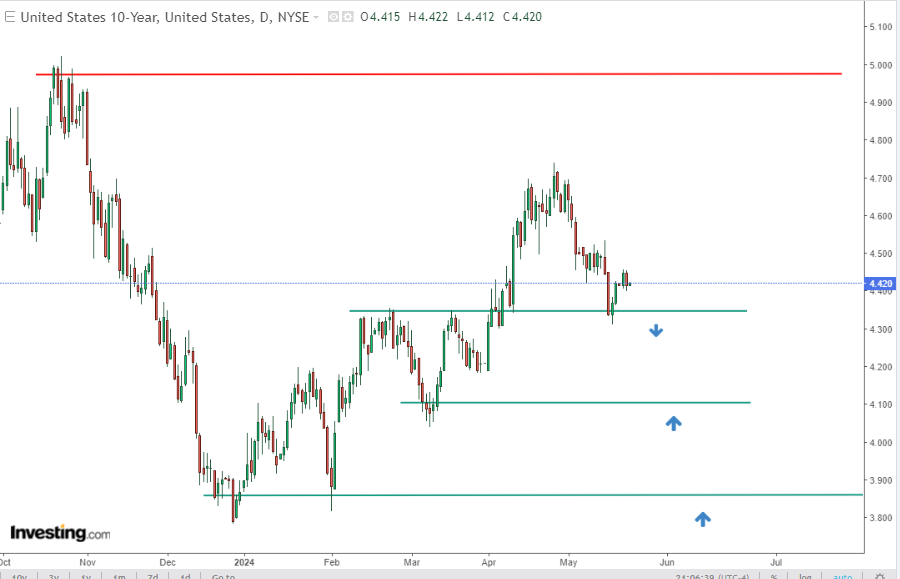
Gold is gleaming as favorable bond market conditions bolster its appeal. This shift is heavily influenced by the recent correction in U.S. Treasury yields, particularly the key 10-year Note. Since the beginning of May, these yields have been falling, reversing the upward trend seen throughout 2023.
This decline in bond yields makes gold a more attractive investment. When bond yields fall, investors tend to seek alternative assets like gold, which doesn't offer a fixed return but is considered a safe haven during economic uncertainty.

If the demand side proves too weak, then in the event of a breakout to the south, the next target for sellers should be the demand zone near 4.10.
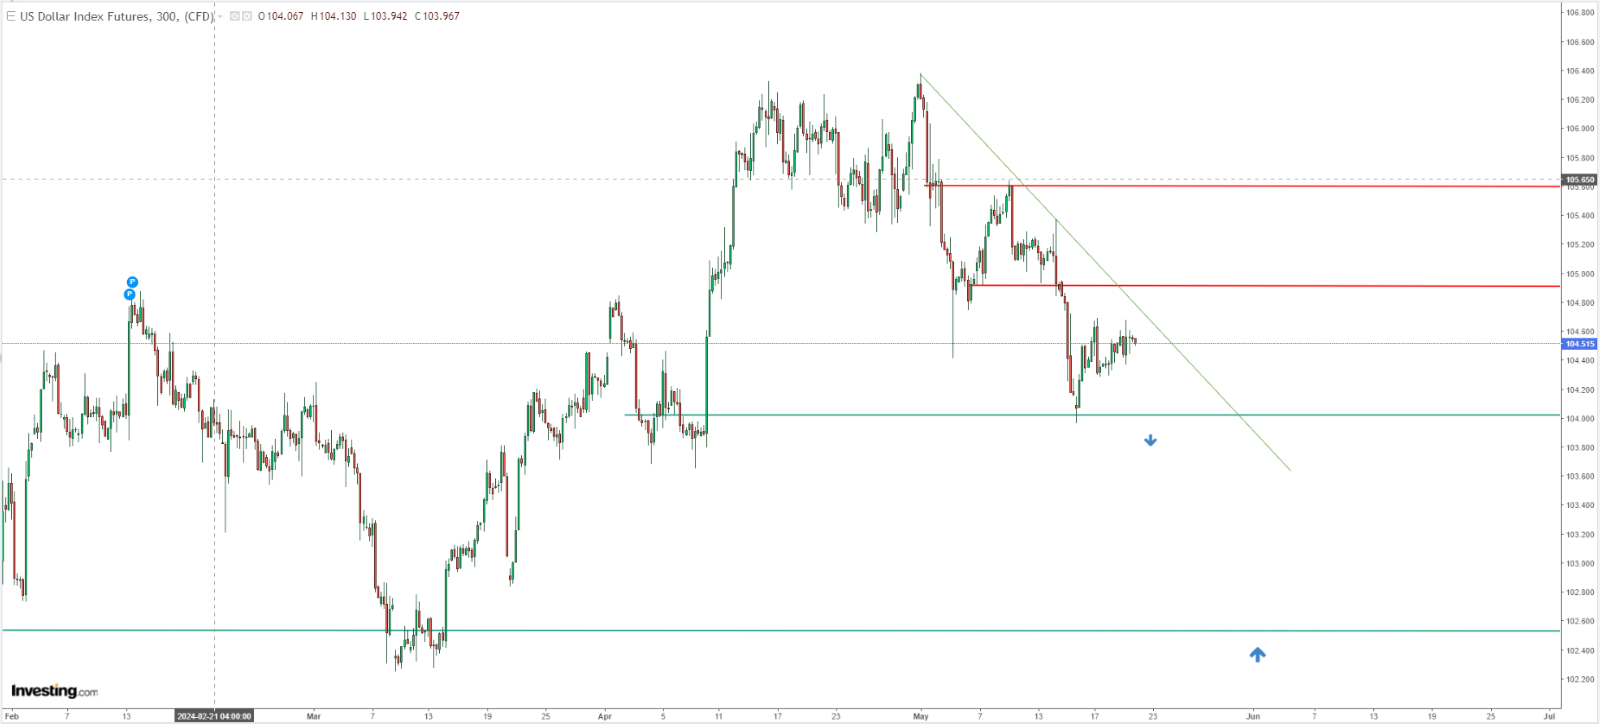
A weakening US dollar also strengthens gold's case. The DXY is currently in a downtrend, similar to the 10-Year Note. A key support level for the DXY sits around 104 points. If the index breaks below this level, it could fall further to the March 2024 lows near 102.50.

Both a declining dollar and falling bond yields create a strong tailwind for gold prices. This confluence of factors increases the likelihood of gold reaching $2,500 per ounce in the coming weeks.
However, a caveat remains. If demand for gold weakens, a price breakout to the downside is possible.
Gold, Silver to Give Buying Opportunity for Latecomers?
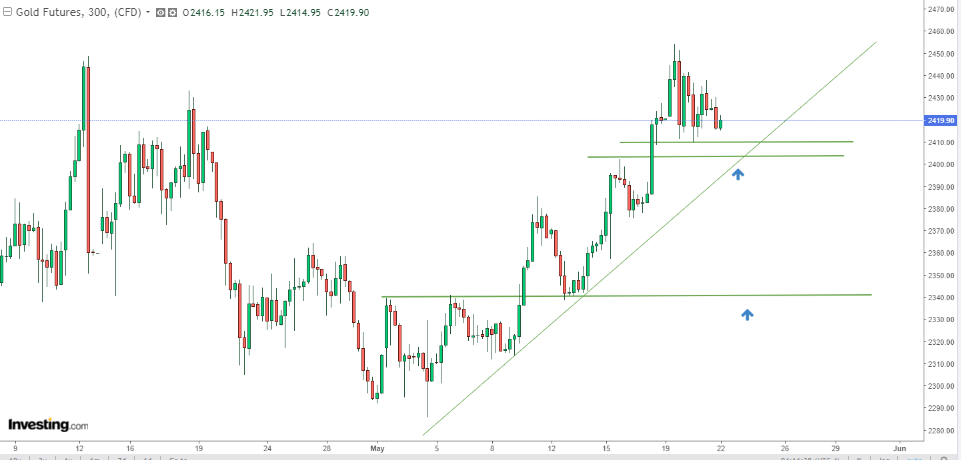
Gold prices, after hitting record highs, have cooled off and entered a consolidation phase. This consolidation currently appears as a descending right triangle on the chart.

The critical area to watch is the triangle's base, formed by a cluster of support levels around $2,400-$2,410 per ounce, further strengthened by an upward trend line. If sellers manage to break below this support, gold could be headed for a test of the next support level near $2,340 per ounce.
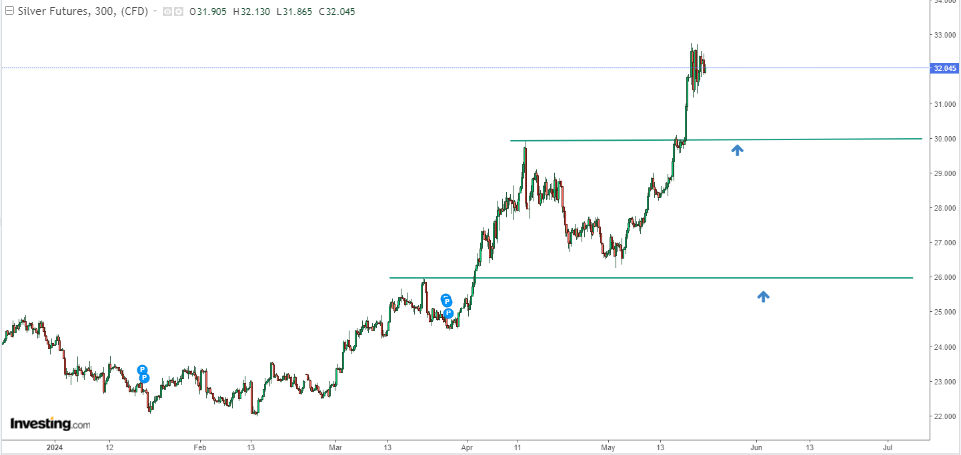
Silver is in a similar situation but with more pronounced upward momentum. It needs a deeper correction to establish a solid support level and connect back to its uptrend . The first potential support zone for long positions in silver appears to be the psychological barrier of $30 per ounce.

If a correction unfolds, even a shallow one, it could present a good entry point for investors waiting for a lower price to join the uptrend based on long-term projections. However, it's crucial to remember that this scenario is more likely to play out if both the US dollar and Treasury notes stay above their current key support levels.
***
Want to try the tools that maximize your portfolio? Take advantage HERE AND NOW of the opportunity to get the InvestingPro annual plan for less than $9 per month.
For readers of this article, now with the code: INWESTUJPRO1 as much as a 10% discount on annual and two-year InvestingPro subscriptions.ProPicks: AI-managed portfolios of stocks with proven performance.
-
- ProTips: digestible information to simplify a lot of complex financial data into a few words.
-
Advanced Stock Finder: Search for the best stocks based on your expectations, taking into account hundreds of financial metrics.
-
Historical financial data for thousands of stocks: So that fundamental analysis professionals can delve into all the details themselves.
-
And many other services, not to mention those we plan to add in the near future.
Act fast and join the investment revolution - claim your OFFER HERE!
Disclaimer: The author does not own any of these shares. This content, which is prepared for purely educational purposes, cannot be considered as investment advice.

