The gold stocks enjoyed a strong surge early this year, fully reversing their sharp post-election losses. While they spent much of February consolidating before sliding, this sector’s seasonals will soon turn very favorable again in mid-March. The gold miners have long enjoyed strong spring rallies in bull-market years. Early March’s seasonal lull is a great opportunity to deploy aggressively ahead of this big spring buying.
Seasonality is the tendency for prices to exhibit recurring patterns at certain times during the calendar year. While seasonality doesn’t drive price action, it quantifies annually-repeating behavior driven by sentiment, technicals, and fundamentals. We humans are creatures of habit and herd, which naturally colors our trading decisions. The calendar year’s passage affects the timing and intensity of buying and selling.
Gold exhibits high seasonality, which seems counterintuitive. Unlike grown commodities like crops, the mined supply of gold is constant year-round. But supply is only half of the fundamental supply-demand equation that drives pricing. Gold’s investment demand happens to be highly seasonal, and that’s what sets gold prices at the margin. Investors favor gold buying far more during some parts of the year than others.
This gold-demand seasonality is well-known and heavily studied. The seasonal gold year starts in late July as Asian farmers begin reaping their harvests. They plow some of their surplus income into gold. That’s followed by the famous Indian wedding season in autumn, with its heavy gold buying for brides’ dowries. That culture believes festival-season weddings have greater odds of yielding long, successful marriages.
After that comes the Western holiday season, where gold jewelry demand surges for Christmas gifts for wives, girlfriends, daughters, and mothers. Following year-end, Western investment demand balloons after bonuses and tax calculations as investors figure out how much surplus income the prior year generated for investment. Then Chinese New Year gold buying flares up after that heading into February.
These understandable cultural factors drive surges of outsized gold demand between summer and early spring. But interestingly, there is one more gold-demand spike in spring. Over the years I’ve seen a variety of theses explaining this April-and-May seasonal gold rally, but nothing definitive like for the rest of the year’s gold seasonality. As silly as it sounds, I suspect spring itself is the reason for this demand surge.
Sentiment exceedingly influences investing, which requires optimism for the future. Investors won’t risk deploying their scarce capital unless they believe it will grow. And the glorious increased daylight and warming temperatures of spring naturally breed optimism. The vast majority of the world’s investors are far enough into the northern hemisphere that spring has a major impact. This seasonality extends to stocks too.
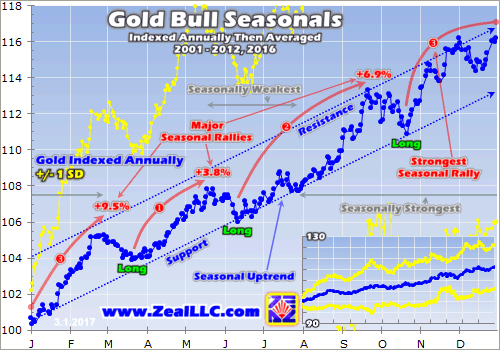
Whatever the reason, gold definitely exhibits strong bullish spring seasonality as this chart reveals. As prices behave very differently in bull and bear markets, seasonality differs between them. Gold was in a mighty bull market between April 2001 and August 2011, powering 638% higher. 2012 saw a normal bull-market correction following an incredible upleg, seeing gold down 18.8% at worst from its 2011 peak.
But everything changed in 2013 as the Fed’s wildly-unprecedented open-ended QE3 campaign ramped to full speed. That radically distorted the markets, levitating stocks which crushed demand for alternative investments led by gold. So gold plunged into an artificial bear that year. In Q2’13 alone, it plummeted by 22.8% which was its worst calendar quarter in an astounding 93 years! Gold’s bear continued until late 2015.
Remember the formal threshold for declaring bull and bear markets is a 20% + counter move from the preceding extreme on a closing basis. After slumping to a 6.1-year secular low in mid-December 2015, gold reentered formal bull-market territory with a 20%+ gain by early last March. Gold’s young new bull grew to 29.9% by early July, confirming its status. Despite gold’s sharp post-election plunge, 2016 was a bull year.
This metal still rallied 8.5% last year, better than the bull years of 2012 and 2008 which saw 7.0% and 5.7% gains. 2016 proved gold is officially back in a bull market after those dark Fed-induced bear-market years between 2013 to 2015. Price behavior is naturally very different in bulls and bears, which drives differing bull and bear seasonality. With gold back in a bull, it’s important to understand its bull-market seasonality.
So this first chart distills down gold’s seasonality in the bull-market years from 2001 to 2012, and 2016. The methodology is simple. Gold is individually indexed within each calendar year, with its close on the final day of the preceding year recast at a level of 100. Then all gold’s closes that year are indexed off that prior-year-close baseline. So an indexed level of 110 means gold was up 10% year-to-date at that point.
This indexing is necessary to keep gold price moves comparable in percentage terms across years with differing prevailing gold prices. Gold averaged $604 in 2006 and $1250 in 2016, but a 10% move is the same in either year. Each calendar year’s individually-indexed gold prices are then averaged together to arrive at this gold-bull seasonality. It reveals gold’s tendency to enjoy a major rally in the spring months.

Between 2001 to 2012 and 2016, gold averaged a strong 3.8% gain between mid-March and late May. In precise terms it bottomed seasonally on the 15th trading day of March, then peaked seasonally on the 17th trading day of May. So gold’s spring seasonal rally clocks in at 2.1 months. Annualize those gains, and gold is rising at a 22% pace. That’s excellent despite gold’s spring rally being its weakest seasonal one.
The Asian-harvest and Indian-wedding-season autumn rally from mid-June to mid-September averages a 6.9% gain in modern bull-market years. That’s dwarfed by the Western-Christmas and Chinese-New-Year winter rally from late October to late February that enjoys the largest average gain of 9.5%. But gold’s spring rally is still very solid and profitable to trade, primarily because gold stocks really leverage gold’s gains.
And this year’s spring gold rally has much-greater potential than average. Following their mass exodus from gold in Q4’16 on that crazy Trumphoria stock-market surge, investors are radically underinvested in gold today. As these lofty, euphoric, wildly-overvalued stock markets inevitably roll over into their long-overdue next bear, investors will have to do massive gold buying to prudently diversify their stock-heavy portfolios.
Gold tends to move counter to stock markets, making it the ultimate portfolio diversifier. So investment demand for this anti-stock trade surges when stock markets weaken. Futures speculators also have far too little gold exposure after fleeing in Q4. So they will also soon need to do big gold-futures buying to normalize their positions. That will be further catalyzed by the super-overcrowded long-U.S.-dollar trade reversing.
Given these extreme market conditions in stocks and the dollar, investors and speculators alike are way too bearish on gold and thus way underdeployed. So this year’s spring gold rally has a high chance of exceeding its seasonal averages to the upside. Nothing begets buying like buying, since it drives prices higher and entices in more capital. Gold is beautifully set up for a powerful virtuous circle of buying this spring.
And as goes gold, so go gold stocks. Gold stocks also exhibit strong seasonality, which is of course the direct result of gold’s own seasonality. Since gold-mining costs are largely fixed when mines are being planned, fluctuations in gold’s price flow directly into amplified moves in gold-mining profits. Higher gold prices drive much-higher earnings for the gold miners, which attract in more investors to bid up stock prices.
The ironclad historical relationship between the price of gold, gold-mining profitability, and therefore the gold-stock price levels is exceedingly important to understand. If you need to get up to speed, I wrote an essay looking at gold-stock price levels relative to gold a couple months ago. Fundamentally gold stocks are leveraged plays on gold. Thus they really outperform in the spring due to gold’s strong seasonal rally.
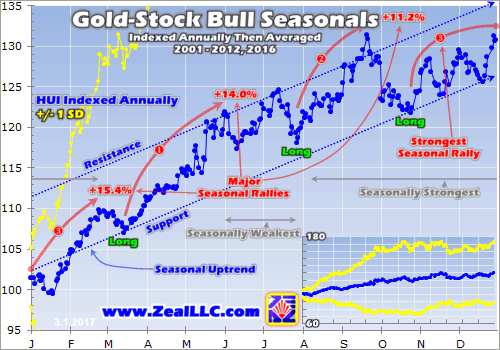
This next chart applies this same bull-market-seasonality methodology used on gold directly to the gold stocks. It looks at the average annual indexed performance in the flagship HUI NYSE Arca Gold BUGS Index in these same bull-market years of 2001 to 2012 and 2016. Because of gold’s dominant influence over gold-mining earnings, gold-stock seasonality naturally mirrors and amplifies gold’s own seasonality.

Gold stocks enjoy strong seasonal rallies corresponding with gold’s own. Yet unlike gold’s which vary considerably, gold stocks’ seasonal rallies have been much more consistent on average during these bull-market years. Starting in spring, they ran 14.0%, 11.2%, and 15.4% compared to gold’s 3.8%, 6.9%, and 9.5%. The seasonal gains in gold stocks are more-evenly distributed over the calendar year than gold’s.
While 13 bull-market years are indexed and averaged in this chart, last year’s outsized gold-stock action still really influenced these seasonals. As measured by the benchmark HUI, gold stocks blasted 182.2% higher in just 6.5 months between mid-January and early August. Later the post-election gold exodus on stock-market Trumphoria helped drive a massive 42.5% HUI drop by the recent mid-December bottom.
So this entire gold-stock-bull seasonal chart shifted higher by about 5 indexed points compared to last year’s version before 2016! Nevertheless, the magnitude of the spring gold-stock rally didn’t change much. It now runs 14.0% on average from the 11th trading day of March to the second trading day of June, a 2.6-month span. That is only up slightly from 13.7% pre-2016, and annualizes to hefty 65% gains.
That’s not out of line at all for this super-volatile sector that has long richly rewarded smart contrarians. In all of last year, the HUI still rocketed 64.0% higher trouncing every other sector despite all that brutal fourth-quarter selling. In gold stocks’ last secular bull between November 2000 and September 2011, the HUI skyrocketed 1664% higher over 10.8 years. That works out to huge 30%+ compound annual gains!
Thus a 14% spring gold-stock rally is unexceptional, merely average in bull-market years. Maybe gold stocks will drift lower like usual into mid-March, blessing investors and speculators with more time to amass positions before the coming surge. But maybe gold stocks’ recent February consolidation then slide pulled forward that seasonal selling, paving the way for the spring rally to start earlier than usual this year.
From the HUI’s recent late-February low, a garden-variety average 14.0% spring rally would catapult this benchmark index near 223 by early June. That’s nothing to sneeze at, as it would take gold stocks’ new upleg since mid-December to 37% gains. There’s no other sector in all the stock markets that can rival that kind of performance. But like gold, gold stocks’ spring rally this year has great potential to prove outsized.
While gold stocks have enjoyed a strong new upleg this year, there hasn’t been much enthusiasm as evident in waning volume. The leading gold-stock trading vehicle that closely mirrors the HUI, the GDX VanEck Vectors Gold Miners ETF (NYSE:GDX), has seen capital volume fall on balance this year despite the higher gold-stock prices. This surprising volume divergence reflects much residual bearishness still plaguing gold stocks.
After suffering an extraordinary three mass stoppings in Q4, investors and speculators remain very wary of this sector. By the third mass stopping in mid-December following a more-hawkish-than-expected Fed, gold-stock selling exhaustion was hit. While gold stocks have seen some contrarian buying since then, this year’s new upleg has been driven more by a lack of selling than major new buying from traders.
With gold stocks still mired in universal bearishness, elite traders including hedge funds have very little exposure to this high-potential sector. So once gold starts powering higher on the lofty stock markets and US dollar rolling over, gold-stock demand is going to just explode. Given the precariousness of this Trumphoria stock-market rally built on nothing but hope, it should falter by gold’s spring-rally timeframe.
Don’t underestimate the gold-stock upside that can be driven by herd psychology shifting from bearish to bullish. During this same spring-rally period last year from mid-March to early June, gold stocks as measured by the HUI soared 34% higher. They greatly outperformed over that spring-rally span even though gold really underperformed with an anemic sub-1% rally! It’s not just gold, but gold expectations.
With low enthusiasm for and participation in gold stocks’ new upleg so far, they are perfectly set up for a major influx of rally-fueling capital as perceptions shift. Higher spring-rally gold prices would certainly motivate investors and speculators to redeploy into gold stocks. But so could higher gold-stock prices alone, just like we saw a year ago. Buying begets buying, helping to put this sector back on traders’ radars.
An increase in general gold bullishness could do it too, even before gold starts powering higher again in a serious way. Nervousness is rightfully growing over the extreme risks inherent in this enormous long-in-the-tooth stock-market bull trading at bubble valuations. The more expectations mount for the long-overdue major stock selloff to ignite, the more attractive gold becomes. That will really alter gold-stock sentiment.
So it wouldn’t surprise me one bit to see gold stocks’ spring rally this year really outperform its seasonal averages again. Instead of a 14% gain, gold stocks could easily enjoy spring-rally gains double or triple that given this superbly-bullish setup. Now is the time to get your capital deployed in elite gold stocks and silver stocks with superior fundamentals, before the coming spring rally drives them much higher.
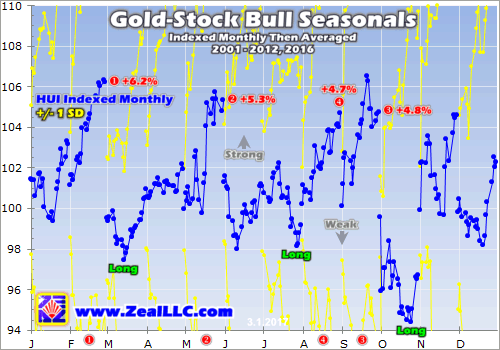
Interestingly gold stocks’ bull-market-year spring-rally gains are fairly lumpy within that span. This final chart breaks down gold-stock-bull seasonality as exhibited by the HUI into calendar months. Each is indexed to 100 as of the previous month’s final close, and then individual calendar months’ indexes are averaged across gold-stock-bull calendar years. These monthly seasonals flesh out the spring rally’s internals.

After gold stocks’ mid-March seasonal lull, they tend to enjoy an initial strong surge into the end of this month. That averaged out to a 3.2% gain in these bull market years of 2001 to 2012 and 2016. But the rapid gains soon moderate seasonally in April, which has seen smaller average gains of just 1.9%. Then the gold-stock buying roars back again in May, which has enjoyed monster 5.3% average gains seasonally.
So the key is to get all your gold-stock capital deployed by mid-March, and not get discouraged in April when the fast early gains peter out. The climax of the spring rally comes in May when most of its gains are won. May is actually the second-strongest month seasonally in modern gold-stock bull years, only exceeded by February’s 6.2% rally. But don’t make the mistake of assuming seasonal timing is precise.
I’ve studied and written about gold and gold-stock seasonality for many years now. And without a doubt the most-important thing to realize is seasonals are mere tendencies. While these averages over years are driven by underlying sentiment, technicals, and fundamentals, the seasonals can easily be overpowered in any year by these same driving forces. Seasonals are like tailwinds or headwinds, not primary engines.
While an outsized spring gold-stock rally is highly likely this year, it could very well play out differently than the seasonal averages. Remember last year saw gold stocks soar about 34% in this spring-rally span. But it sure didn’t go according to script. The HUI skyrocketed 31.0% last April, defying its usual modest rally. That extreme April buying pulled forward May’s, thus the HUI mean reverted to fall 13.8% that month.
Spring’s strong seasonal tailwinds for gold stocks can be overwhelmed by sentiment and technicals, which can amplify them, cancel them out, or buck them entirely. While 2017’s spring-rally setup for both gold and gold stocks is exceptionally bullish, don’t get wrapped up in the apparent precision that these bull-market averages imply. Without that long-term smoothing effect, seasonals unfold more sloppily in real-time.
While investors and speculators alike can certainly play gold stocks’ coming spring rally with the major ETFs like GDX, the best gains by far will be won in individual gold stocks with superior fundamentals. Their upside will trounce the ETFs’, which are burdened by over-diversification and underperforming gold stocks. A carefully-handpicked portfolio of elite gold and silver miners will generate much-greater wealth creation.
At Zeal we’ve literally spent tens of thousands of hours researching individual gold stocks and markets, so we can better decide what to trade and when. As of the end of Q4, this has resulted in 906 stock trades recommended in real-time to our newsletter subscribers since 2001. Fighting the crowd to buy low and sell high is very profitable, as all these trades averaged stellar annualized realized gains of +22.0%.
The key to this success is staying informed and being contrarian. That means buying low when others are scared. So we’ve been aggressively adding new trades in this week’s selloff. An easy way to keep abreast is through our acclaimed weekly and monthly newsletters. They draw on our vast experience, knowledge, wisdom, and ongoing research to explain what’s going on in the markets, why, and how to trade them with specific stocks. For only $10 per issue, you can learn to think, trade, and thrive like a contrarian. Subscribe today, and get deployed in great gold stocks before the spring rally erupts.
The bottom line is gold stocks experience a strong spring rally seasonally. This is driven by gold’s own seasonality, where outsized investment demand arises at certain times during the calendar year. Gold experiences a strong spring rally likely driven by the universal optimism this season brings. And since gold drives gold miners’ profitability, their stock prices naturally follow it higher while amplifying its gains.
And gold stocks’ already-strong spring rally is likely to prove exceptional this year. With gold and gold stocks heavily sold after the election, traders remain greatly underdeployed. As this crazy Trumphoria stock-market rally inevitably fails, demand for gold and gold stocks will flare intensely again. This sector’s usual early-March seasonal lull is a great time to deploy aggressively ahead of that strong spring rally.
