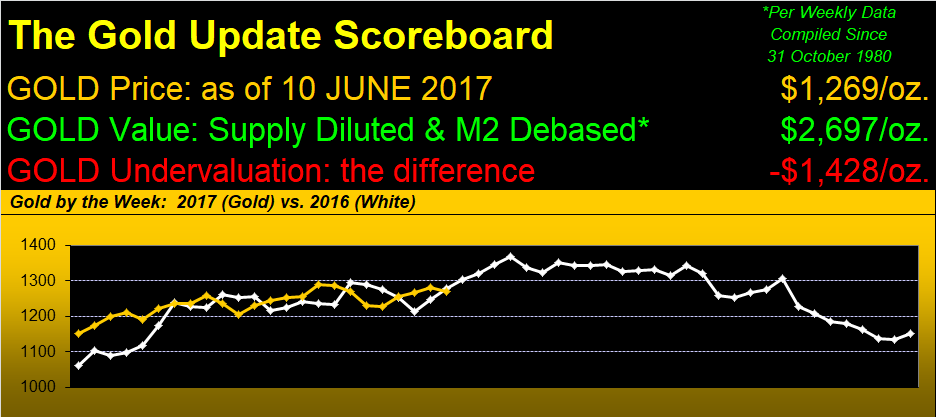
Provencial greetings from the stunningly gorgeous Vaucluse. Contrary to the fast-paced rat race of San Francisco, here in the South of France amongst these vast vineyards and rolling hills of dark greenery beneath the majestic beauty of Mont Ventoux, life slows way down ... as did the price of Gold this past week in settling yesterday (Friday) at 1269.
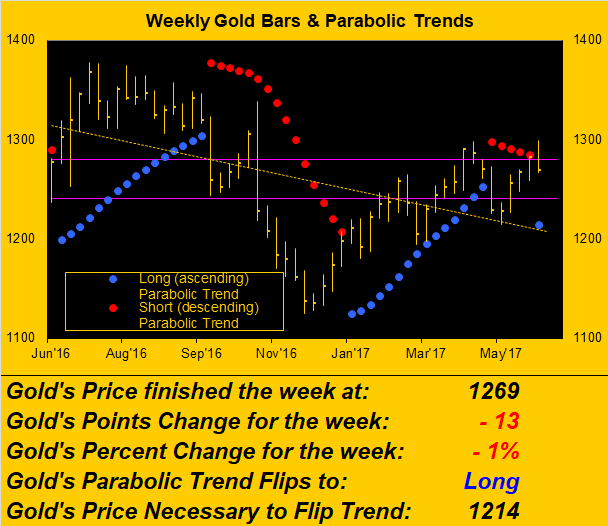
Brief as is our missive this time 'round, we at least wish to bring to you our most salient graphics. And with the above panel showing us gold's challenge to now maintain pace with where 'twas a year ago, let's go straightaway with the weekly bars. As is typical of markets, when "visible" upside resistance gets penetrated, price can leap quite swiftly.
Such was the case for gold this past Tuesday in busting up through what had been the declining red dots of parabolic Short trend, flipping it to Long, and in turn sending price up to a marginal new high for this year of 1298. But come the political posturing StateSide and British polling from this side of the pond, so too came so-called "dollar strength", sending sterling back down along with the EuroCurrencies, taking along in their stride gold.
Thus our yellow metal presently finds itself back inside the purple-bounded 1240-1280 resistance zone despite price having made "higher-lows" and "higher-highs" for four consecutive weeks, a phenomena into which traders may further take profits. Either way, we'd like to see this new parabolic Long trend bring the 1300s into fruition -- as was the case from this point a year ago -- rather than fail. Here are the bars:

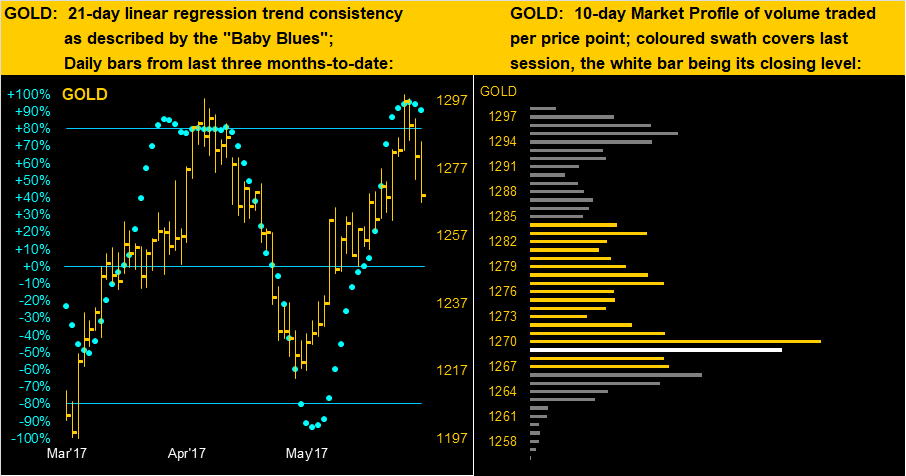
Next let's leap to gold's daily bars for the past three months on the left, along with the 10-day Market Profile on the right. Note that the baby blue dots of day-to-day 21-day linear regression trend consistency are rolling over from above their +80% level, suggestive of still lower prices ahead; the key of course is not to find Gold breaking below the 1240-1280 resistance zone. And to keep from so doing, 'twould be nice to see price quickly regain the support of that lengthy 1270 horizontal bar in the profile:

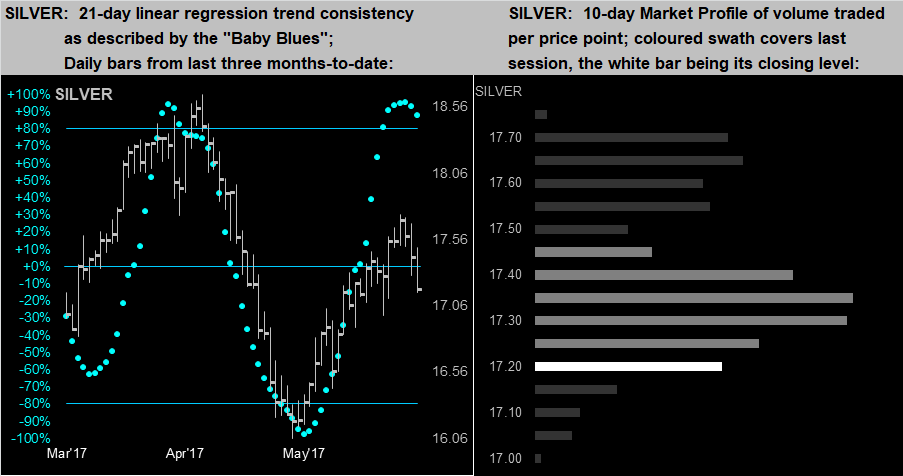
The same analyses apply, too, to Sister Silver, her "Baby Blues" (left) rolling over, with the need for price to climb back above her 17.35 level:

So with your appreciation and patience in waiting for this week's brief price, we'll leave you with this thought: the share prices of Alphabet (NASDAQ:GOOGL) and Amazon (NASDAQ:AMZN) having both eclipsed the maniacal $1,000 mark ... and with intangibly abstract bitcoin again setting a record high, as our beloved charter reader JGS would say: "Sumthin's gonna happen..." Ya think? Think Gold!