This past week, the U.S. Bureau of Labor Statistics (BLS) released the Consumer Price Index (CPI) for February 2022. The CPI is the most widely used measure of inflation.
The full report is 37 pages long. I reviewed it and summarized it in plain English here.
What Does CPI mean?
The CPI measures the prices that individual people who live in cities across the U.S. pay for a range of goods and services, including such as transportation, food, and medical care.
The data is taken from a body of people representing 93% of the population of the U.S. It is obtained from 75 different urban areas across the country.
The full report compares prices against the prior month and the prior year. It also explores inflation in different cities across the U.S. and takes a deep dive into different products and services.
Annual Inflation

Graphic courtesy of Tradingeconomics.com
Annual inflation figures are the average prices of February 2022 compared to February 2021.
Overall prices went up 7.9% annually. The January 2022 annual inflation figure was 7.5%. The February inflation figures are the highest increase since January 1982.
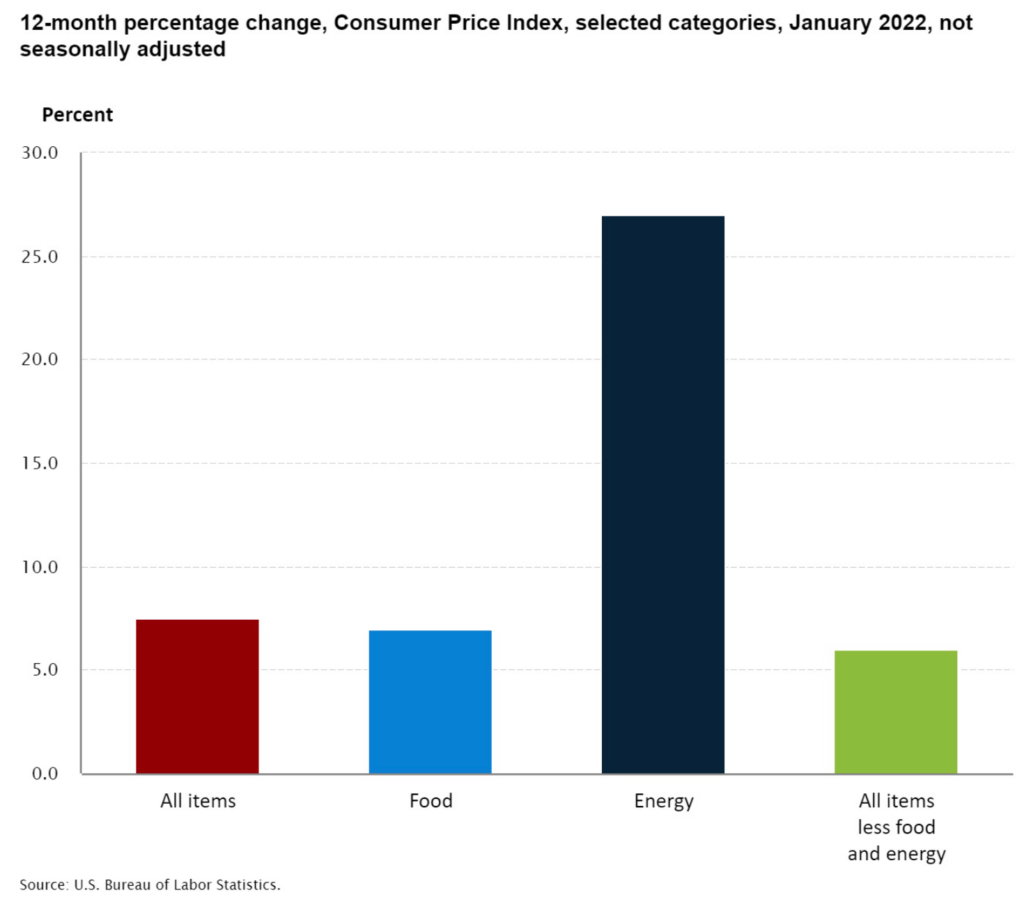
Here are the three broad categories: (January 2022 numbers are in parentheses)

- Energy inflation: 25.6% (was 27%)
- Food inflation: 7.9% (was 7%)
- Core inflation : 6.4% (was 6%)
Here is the annual inflation on some individual items randomly selected:
- Coffee: 10.5%
- Citrus Fruits: 16.2%
- Gasoline: 38%
- Car & Truck Rental: 24.3%
- Buying Used Cars & Trucks: 41.2%
- Smartphones (for a brief look on the bright side): -13.2%
How bad is this level of inflation? Let’s compare it to what it is supposed to be.
The central bank of the U.S. is the Federal Reserve, and is also known as the Fed. Since 1996, the Fed’s monetary policy is aimed at making inflation about 2%.
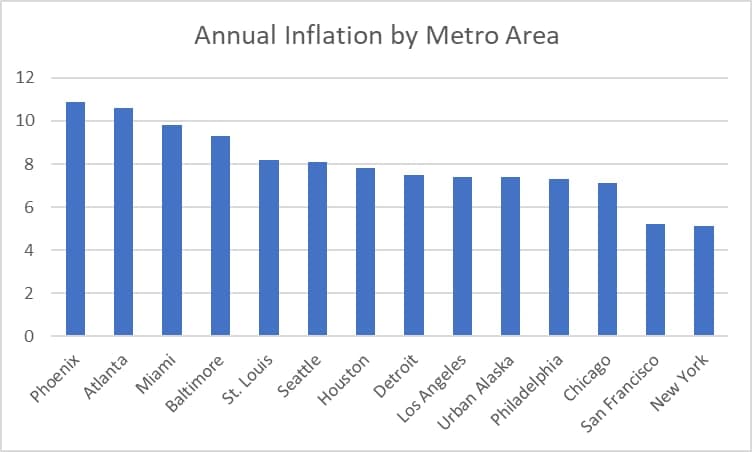
How Does Your City Compare?

Source: Bureau of Labor Statistics
Data from New York, Chicago and Los Angeles metro areas is recorded monthly. The data from the other eleven (11) metro areas listed here were part of the February report.
As you can see Phoenix (10.9%), Atlanta (10.6%), Miami (9.8%) and Baltimore (9.3%) had the highest inflation numbers, while New York (5.2%) and San Francisco (5.1%) had the lowest percent increases.
Data from another nine (9) metro areas were last reported in January and will be part of the March report. These are Boston, Dallas, Denver, Minneapolis, Riverside (California), San Diego, Tampa, Urban Hawaii and Washington, DC.
The highest inflation figures from the metro areas who last reported in January were Tampa (9.6%), Riverside, California (8.6%) and San Diego 8.2%.
The lowest inflation figures from the January group were Washington, DC and Urban Hawaii (6%) followed by Boston (6.3%).
Monthly Inflation
The report also measures monthly price increases.
February 2022 prices against January 2022 prices. January 2022 figures shown here are compared against December 2021.
Overall Inflation
February: 0.8%
January: 0.6%
Food
February: 1.0%
January: 0.9%
Energy
February: 3.5%
January: 0.9%
Core Inflation
February: 0.5%
January: 0.6%
In other words, since last month, price inflation for all items outside of food and energy slowed down, while food inflation slightly increased. Energy inflation skyrocketed.
Energy indirectly affects all other prices too. Food and other items usually have to be flown in an airplane, driven in a car or transported on a ship to get to their final destination. Food is often cooked using natural gas in a restaurant or before going to a store.
Based on the above data, I am projecting that inflation is going to increase again in March, and depending on how long the Russian invasion of Ukraine lasts, inflation could continue to get worse before it gets better.
This article was originally published on https://thelatestblock.com/
Which stock to consider in your next trade?
AI computing powers are changing the Canadian stock market. Investing.com’s ProPicks AI are winning stock portfolios chosen by our advanced AI for Canada, the US, and other exciting markets around the globe. Our top strategy, Tech Titans, nearly doubled the S&P 500 in 2024 - one of the most bullish years in history. And Beat the TSX, designed for broad market exposure, is showing +878% gains with 10 years’ back-tested performance. Which Canadian stock will be the next to soar?
Unlock ProPicks AI