- Several tools are available in the market to help you pick out hidden stocks with upside potential.
- One of the most efficient ones out there is the Investing.com stock scanner.
- With the help of this free tool, users can pick out high-potential stocks using various strategies.
- Get started for free: discover winning stocks today by accessing the new Investing.com screener here!
If you're an investor searching for a straightforward, free tool to uncover high-performing companies with minimal risk, the stock scanner from Investing.com offers a powerful solution.
This tool provides an extensive range of indicators and filters, allowing you to customize searches based on industry and sector.
Today’s focus is on the "Hidden Small Value Gems" strategy, which has not only delivered a robust 9.9% return over the past three months but also maintains a relatively low-risk profile.
This strategy’s approach to filtering companies with low debt and positive cash flow makes it a compelling option for risk-averse investors.

Source: Investing.com
Low Debt and Positive Cash Flow: The Core of the Strategy
The strategy relies on five fundamental filters, each aligning with its core principles. Given its low-risk profile, the strategy focuses on companies with manageable debt and strong cash flows, both in terms of percentage profit and nominal values.
Source: Investing.com
The approach also considers a market capitalization range suitable for smaller companies and a P/E ratio indicative of attractive market valuations.
Ultimately, this process yields 51 potential candidates that meet the criteria, offering a solid foundation for further analysis.
Exploring Additional Filters
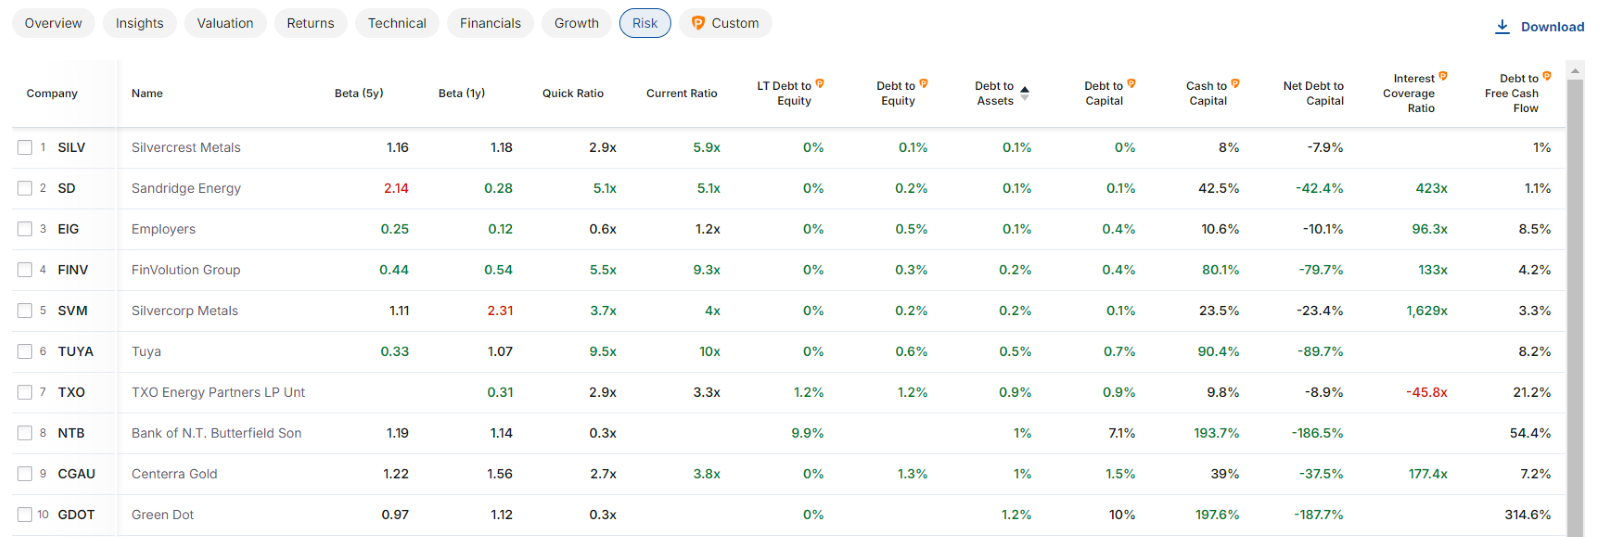
Since this strategy emphasizes low risk, it's crucial to review criteria related to this risk level, as outlined in the risk tab.
Basic filtering by profit-to-asset ratio reveals that the top ten companies possess low debt levels, ensuring they can comfortably manage interest payments.

Source: Investing.com
The first column allows for easy selection and deselection of companies, simplifying navigation through various categories. For instance, marking the top ten companies ensures they remain highlighted when applying filters in other tabs.
Although the combination options are vast, adding more criteria narrows the pool of available companies. However, this selective approach can be advantageous when targeting specific characteristics.
Chart Analysis for Final Decisions
The next step involves chart analysis, accessible by selecting a specific company. This feature provides a detailed technical overview, enabling users to prepare charts and make informed decisions.
The stock scanner tool guides you through this process, making it easier to reach your ultimate investing goal.
By registering for free on Investing.com, you can unlock the full potential of this tool and take your stock market investing to the next level.
Start using the Investing.com stock screener today and discover the power of smart stock selection!
***
Disclaimer: This article is written for informational purposes only. It is not intended to encourage the purchase of assets in any way, nor does it constitute a solicitation, offer, recommendation or suggestion to invest. I would like to remind you that all assets are evaluated from multiple perspectives and are highly risky, so any investment decision and the associated risk is at the investor's own risk. We also do not provide any investment advisory services. We will never contact you to offer investment or advisory services.
