These are such headline-driven days. Stock markets dropped when news broke of the U.S. Democrat’s move to start impeachment proceedings against President Donald Trump. Then, they rebounded when the transcript of Trump’s Ukraine call was released and turned out less damning than some had expected. Gold did the opposite, gaining and then falling.
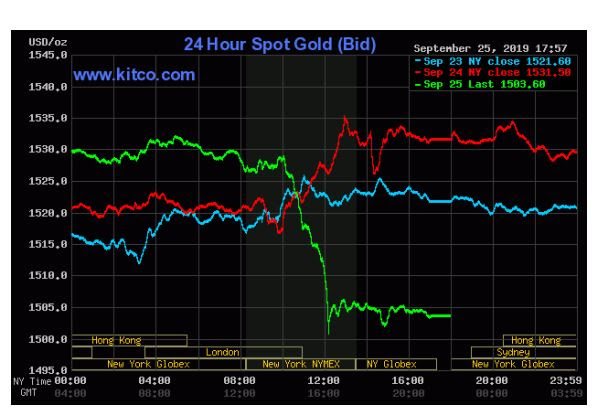
Someone asked me whether recent trading action in gold was concerning. The short answer: no.
First of all, these are headline-driven days. Stocks, bonds, gold, oil – they all jump and dive on the news cycle. However, the vast majority of those moves are fairly small in context. I saw one headline: “S&P 500 drops the most in a month on Trump impeachment concerns.” The most in a month? Is that really worth noting?
Gold’s one-day slide recently is similar. It, too, likely dropped the most in a month, but that dramatization misses two key points:
Headlines do matter, but the details that spark reactions one day fade quickly. What matters are the themes.
And those themes remain:
A messed up bond market. With a quarter of investment grade bonds bearing negative yields, the safe haven trade truly is different this time. Large pools of money that have long relied on bonds for reliable returns are being forced to look elsewhere. Stocks worked for several years but now, based on the three points above, risks are rising.
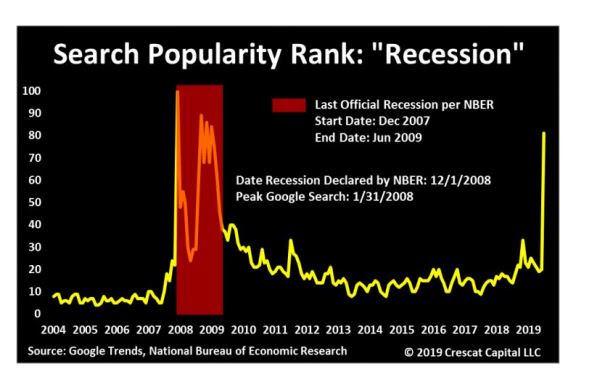
More and more, I think an important theme (that brings all of these together) is the self-fulfilling nature of recessionary fears. Crescat Capital summed this idea up nicely in a recent letter called Necessary, Normal, and Inevitable, in which they predict a recession is imminent partly because investors increasingly think one is around the corner, as well as because evidence is piling up.
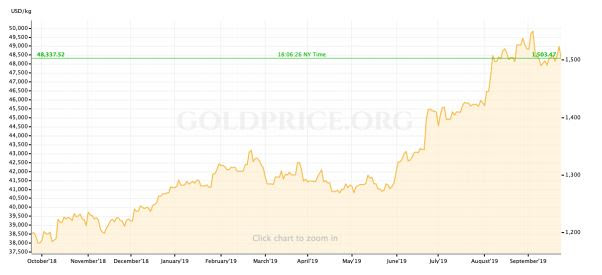
Gold is an answer for all of these themes. That’s why the chart looks so strong. And that’s why I don’t stress when the news cycle sends the yellow metal down on a particular day.
It means there is lots of room for equities to gain once generalist investors decide this market is real and they want to participate.
I’ve gone through the gold equities argument many times. In short: gold bull markets start with the metal itself. As the price of gold gains, gold producers start to move; they offer leverage to the gains in price (they make more money, assuming fairly fixed costs) and they are large, liquid stocks.
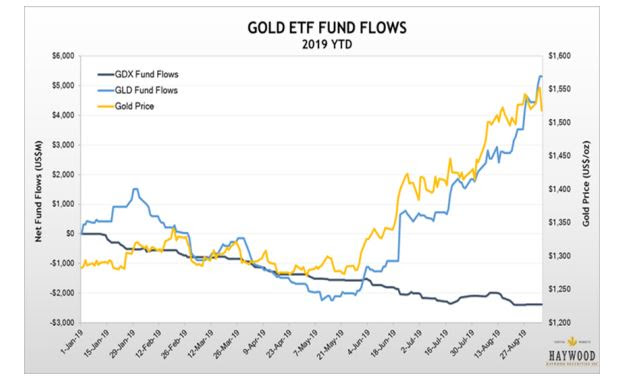
The golden line is the price of gold, the blue line is funds flowing into gold-backed ETFs, and the black line is funds flowing into the main ETF of gold mining stocks, the VanEck Vectors Gold Miners ETF (NYSE:GDX). The divergence is just slightly apparent.
It’s only after that is well and truly established (a point we’re not even quite at yet) that money starts to really rotate down into more speculative stocks.
In fact, even though gold majors have seen very nice gains in this market already (50 to 100%), fund flows into such stocks have remained pretty limited. This chart from Haywood captures things nicely.
A trade war with no end in sight. I know comments have been more positive of late, but I still think it very unlikely that we’ll get a deal anytime soon, which means this very significant drag on global growth will continue.
Macro indicators have been turning down all year. The last time we saw this pattern was 2015 and it preceded recessions in several emerging markets and a Chinese stock market crash. And the global economy is much less stable today than it was then.
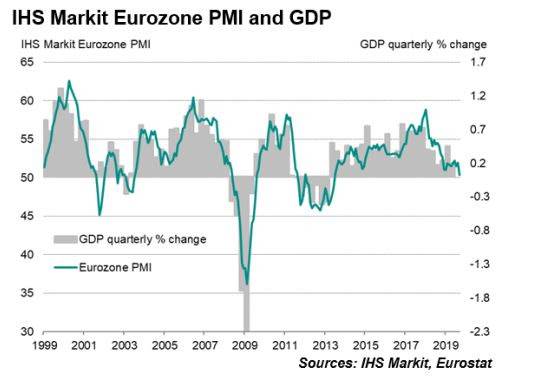
Uncertainty. The EU is truly on the edge of recession (the Flash Eurozone Composite PMI reading, which combines manufacturing and services, was 50.4 for September, barely above the 50 mark that signals contraction; manufacturing is already in contraction). The trade war drags on. Central banks around the world are cutting rates; several are already injecting stimulus. China is struggling to keep its currency stable (to keep trading partners happy) while managing an ongoing debt crisis.
1. Gold is up 17% since early July. Setbacks of 1.6% happen when a gain like that consolidates, especially when you’re talking about a price that reacts to so many influences.
2. Gold bounced decisively at $1,500 per oz. and stayed above. That helps maintain a chart that looks technically strong.
