It's been a rough few days for stock market investors. Profit-taking across all major indices has meant increased pressure for many stocks, especially tech shares, and once again, Wall Street has been paying increased attention to the CBOE Volatility Index (VIX), the benchmark for US stock market volatility.
Investors also call VIX the "fear-index." It's currently hovering at 22 while in the early days of the coronavirus pandemic, it was well over 80.
For retail investors, increased volatility typically feels unnerving. However, diversification in a long-term portfolio makes it easier to manage risk when it arises.
Today, we discuss two exchange-traded funds (ETFs) that could be appropriate for readers wishing to diversify their portfolios in the coming weeks.
1. iShares MSCI USA Min Vol Factor ETF
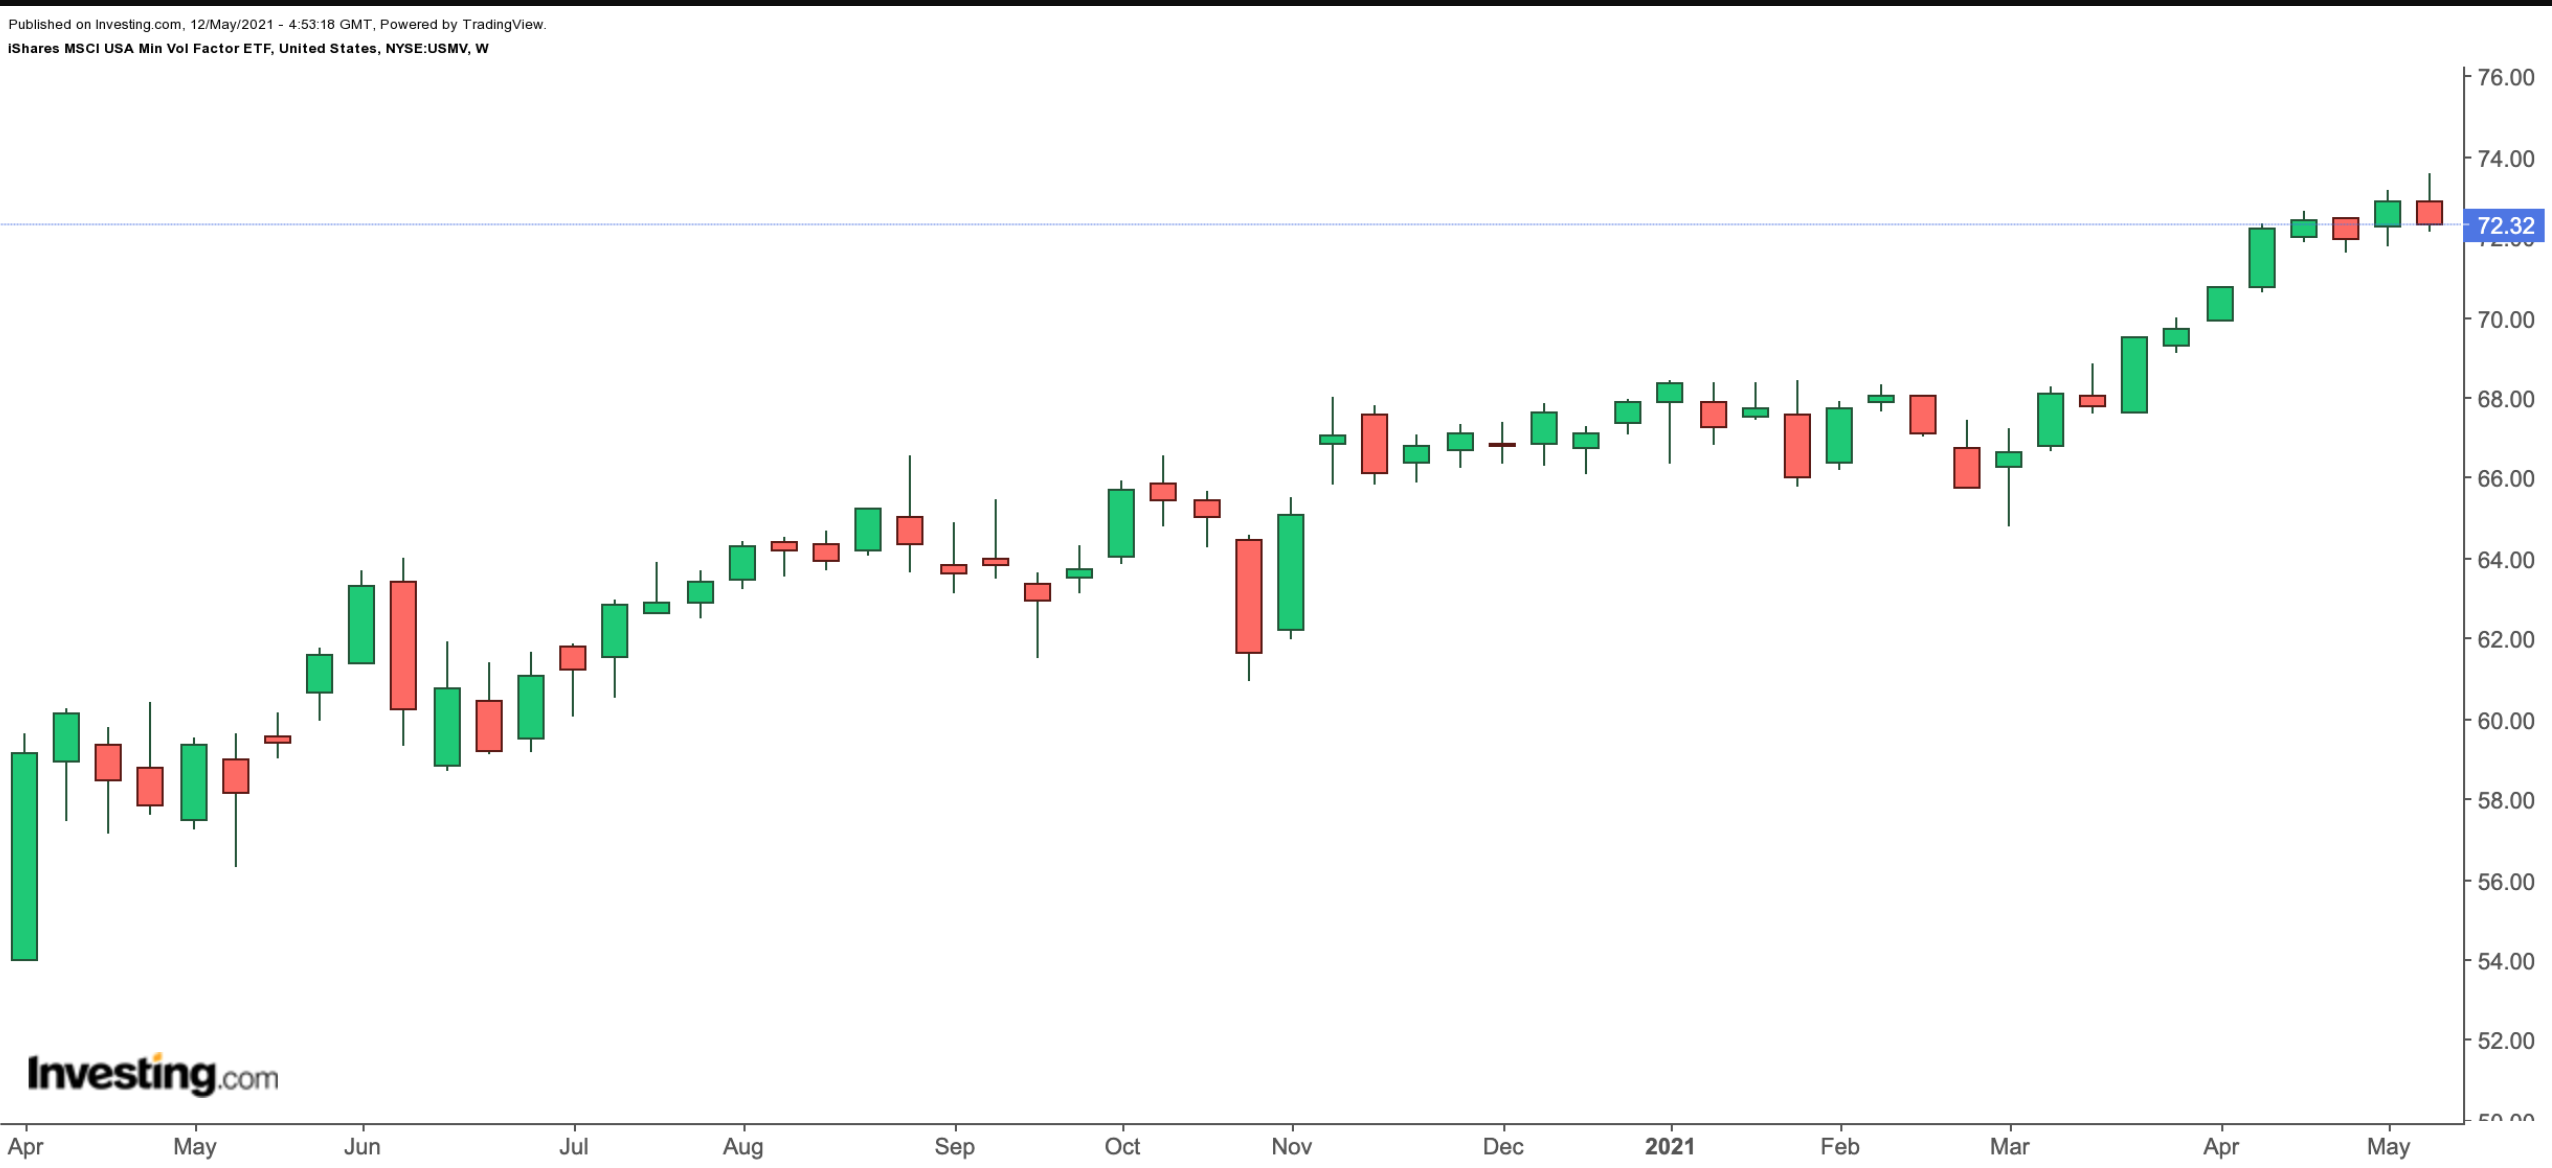
Current Price: $72.32
52-Week Range: $56.31 - $73.61
Dividend Yield: 1.69%
Expense Ratio: 0.15% per year
The iShares MSCI USA Min Vol Factor ETF (NYSE:USMV) invests in US stocks expected to be less volatile than the broader market. Since its inception in October 2011, net assets have grown to $29.1 billion.

USMV, which has 185 holdings, tracks the returns of the MSCI USA Minimum Volatility (USD) Index. The top 10 firms comprise around 16% of the fund. None of the holdings account for more than 1.65% of the total portfolio, which means the performance of any one company does not have the ability to move the fund by itself.
In terms of sector allocation, information technology has the highest slice (23.10%), followed by health care (18.65%), consumer staples (10.74%), financials (9.36%) and communications (9.19%). Among the leading names are Waste Management (NYSE:WM), Microsoft (NASDAQ:MSFT), Johnson & Johnson (NYSE:JNJ), Accenture (NYSE:ACN), Newmont Goldcorp (NYSE:NEM) and McDonald's (NYSE:MCD).
Year-to-date, the ETF is up 7% and hit a record high in recent days. Trailing P/E and P/B ratios stand at 28.45 and 4.54, respectively. In the case of further declines in broader markets, several of the names in the fund could also come under pressure. However, we like the diversity of USMV and would consider buying the dips in the fund.
Investors should also note that the fund's beta, which shows how sensitive its price is to a change in the market, stands at 0.75. The beta of the broader market, such as the S&P 500 Index, is 1. Thus, USMV would be expected to return 75% as much as the overall market. On the other hand, a stock with a beta of 1.25 would move 25% more than the overall market.
A low-beta fund typically has less risk but lower returns. Analysts and scholars debate the best use of beta. After all, it does not provide any information about the holdings within the fund.
However, many market participants look at beta as a gauge of short-term volatility. Most tech and high-growth shares, which have been the darlings of Wall Street in the past 12 months, have high betas. They are also the ones falling hard this week.
2. SPDR Portfolio S&P 500 High Dividend ETF
Current Price: $41.23
52-Week Range: $24.31 - $42.41
Dividend Yield: 5.42%
Expense Ratio: 0.07% per year
The SPDR® Portfolio S&P 500 High Dividend ETF (NYSE:SPYD) invests in stocks that provide a high level of dividend income and have potential for capital appreciation. The fund started trading in October 2015, and net assets stand at $2.7 billion. Put another way, in the current low-rate environment, passive income seekers have been putting capital into the ETF.

SPYD, which has 78 holdings, tracks the S&P 500 High Dividend Index that serves as a benchmark for dividend seekers. It measures the performance of the top 80 high dividend-yielding stocks in the S&P 500, based on dividend yield.
The top 10 firms make up less than 15% of the fund, and no company has a weighting of more than 1.6%. In terms of sectoral breakdown, financials (24.09%) has the top spot. Next in line are real estate (18.17%), energy (14.31%), utilities (12.92%) and information technology (6.50%).
Data storage firm Seagate Technology (NASDAQ:STX), activewear apparel group Hanesbrands (NYSE:HBI), real estate investment trust (REIT) Regency Centers (NASDAQ:REG) and data and record storage group Iron Mountain (NYSE:IRM) lead the names in the ETF.
Since the start of the year, SYD has returned more than 27%.Trailing P/E and P/B ratios of 15.70% and 1.83% as well as the current dividend yield suggest the fund is likely to reach new highs in the weeks ahead.
Seasoned investors would concur that many market participants do not tend to sell dividend shares in panic, even when markets come under pressure.
