
If you’re trading on BMO (TSX:BMO) InvestorLine, here are a few BMO ETFs worth considering for a globally diversified portfolio.
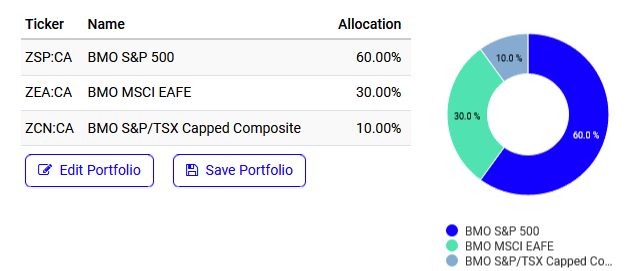
BMO S&P 500 Index ETF (ZSP)
60% of the portfolio goes to ZSP, giving you instant access to 500 large-cap U.S. stocks screened for earnings quality via the S&P 500.
You probably know this index is notoriously hard to beat—SPIVA data shows that 88% of active funds underperform it over a 10-year period.
Currently, the S&P 500 has a heavy overweight to technology, followed by financials, consumer discretionary, and healthcare. Since it’s market-cap weighted, all of the Magnificent Seven stocks sit comfortably in the top 10 holdings.
 as the largest sector, followed by Financials, Consumer Discretionary, and Health Care.")
ZSP has delivered a 15.23% annualized total return over the last 10 years, boosted by a falling USD/CAD and rising US Dollar, as ZSP is unhedged. Keep in mind this performance already factors in the impact of the 15% foreign withholding tax on dividends.
BMO MSCI EAFE Index ETF (ZEA)
U.S. stocks have had a strong run, but they’re now quite expensive. If you want to diversify, it’s time to look internationally—which is why I’d allocate 30% to ZEA.
ZEA tracks the iShares MSCI EAFE ETF (NYSE:EFA), which stands for Europe, Australasia, and the Far East. It provides exposure to developed markets outside North America, including countries like Japan, the UK, France, Germany, and Australia.
, United Kingdom (14.57%), and France as the largest regions, along with smaller allocations across Europe and other countries.")
Why ZEA? It shores up your non-North American exposure, holding 727 stocks across many developed markets. You get broad exposure to blue-chip financials, industrials, and healthcare companies, which are well-represented in the index.
 and Industrials (17.78%) as top sectors, with significant diversity across other sectors.")
The expense ratio is slightly higher at 0.22%, but that’s the price you pay for international diversification. It also comes with a decent 2.7% distribution yield, making it a solid option for income-oriented investors.
BMO S&P/TSX Capped Composite Index ETF (ZCN)
Finally, we’ll round out our portfolio by incorporating a bit of home country bias, with ZCN making up 10% of the portfolio. This allocation is still three times Canada’s actual weight in the MSCI World Index.
ZCN tracks the S&P/TSX Capped Composite, a benchmark of 221 market-cap-weighted holdings. The “capped” part ensures no single stock exceeds 10% of the index at each rebalance.
The fund provides the typical Canadian sector exposure that complements U.S. and international holdings well—namely, overweights to financials and energy.
 and Energy (16.81%) as leading sectors, followed by Industrials and Materials.")
The best part about ZCN? It’s incredibly cheap, with a 0.06% MER, and offers a decent 2.71% distribution yield, most of which comes from tax-efficient eligible dividends.
Putting the portfolio together
With 60% in ZSP, 30% in ZEA, and 10% in ZCN, you’re diversified across over 1,000 stocks spanning the U.S., Canada, and EAFE markets, with a weighted average expense ratio of 0.13%.
From January 2015 to November 2024, this simple, low-cost portfolio—rebalanced quarterly—would have earned you a 12.36% annualized total return, more than tripling an initial $10,000 investment. That’s a strong performance for doing nothing more than buying and holding three index ETFs.
